Search/Navigation:
Related:
SLAC![]() /EPP
/EPP![]() /HPS Public
/HPS Public![]()
Jefferson Lab![]() /Hall B
/Hall B![]() /HPS Run Wiki
/HPS Run Wiki![]()
S30XL-LESA/LDMX
| Table of Contents |
|---|
A new set of components has been developed to replace the now deprecated Monitoring Application. Instead of having all functionality implemented within a single application, the online reconstruction and monitoring has been split up into several different programs in order to provide a scalable and flexible system, which requires much less configuration for shifters who just need to look at the plots. A server creates and manages stations that run the online reconstruction in headless mode. A command line client and interactive console allows the user to send commands to the server and receive responses. Finally, a number of GUI clients such as JAS3 and a Java web application can connect to a remote AIDA tree which shows an aggregated set of plots from all of the stations.
...
You do not have to use this exact directory, but it is recommended to have a dedicated directory for online reconstruction configuration and data files. The instructions in this documentation will generally assume that you are working within this directory.
The updated online reconstruction tools are currently on a branch of HPS Java, which you can checkout and build using a this command such as:
| Code Block | ||||
|---|---|---|---|---|
| ||||
git clone https://github.com/JeffersonLab/hps-java cd hps-java git checkout online-recon-dev mvn clean install -DskipTests |
Now, you should can install the online reconstruction scripts into your work area:
| Code Block | ||||
|---|---|---|---|---|
| ||||
# Go into online recon module within the hps-java project cd online-recon # Install the online recon run scripts to your work dir mvn install -DskipTests -DskipCheckstyle -DassembleDirectory=/scratch # Optionally add the script directory to the path. export PATH=/scratch/bin:$PATH |
The online reconstruction run scripts should now be installed to the /scratch/bin directory, and you should be ready to test the client and server.
| Info | ||
|---|---|---|
| ||
The server cannot startup without connecting to an ET ring. If you are testing the tools outside of the counting house where this is not provided, then follow the instructions belowunder "ET Software" for installing and running the ET software, along with aan ET ring and data producer. |
The connection parameters for your local ET ring need to be specified in an initial server config file like this:
...
These settings provide the hostname where the ET ring is running, the port it is using used for accepting connections, and the name of the buffer file. These need to exactly match either the settings on your actual running ET ring in Hall B or one started on your machine or the server will fail to startup. Currently, these cannot be changed once the server is started.
Once you have Once you have confirmed that the ET ring is running and your configuration file is valid, you may launch the server using a command such asas a background process:
| Code Block | ||||
|---|---|---|---|---|
| ||||
hps-recon-server --host localhost --port 22222 -w $PWD/stations -c my.cfg & |
...
The -w switch gives the directory where station data such as log files will be written out. By default, this is the directory where the server was started.
Finally, the -c option gives the location of the server's initial configuration file, which most importantly contains the parameters for connecting to the ET system (see above).
Instead of writing its printed output to your terminal, the server will create a log file at The server will write its log output to logs/server.log,which you can tail to check the server's log messages using a command like tail -f logs/server.log in order to see the server logs from its handling of client requests. instead of the terminal.
If Now you run the client without any command options, it will opens the interactive online reconstruction console which can be used to configure, create, start/stop and remove stations that run the HPS physics event reconstruction on data from the ET ring.may open the interactive console for sending command requests to the server:
| Code Block | ||||
|---|---|---|---|---|
| ||||
hps-recon-client --host localhost |
...
This will open a prompt that allows you to send commands to the server and see the results in your terminal.
| Info | ||
|---|---|---|
| ||
| Whenever you see online> in a code block, you should run the command in the online reconstruction console rather than your system shell. |
Type help into the console to show the documentation for the client command line interface:
| Code Block | ||||
|---|---|---|---|---|
| ||||
online>helponline> help |
This is the output of the above command:
| Code Block | ||||
|---|---|---|---|---|
| ||||
GENERAL

    help - print general information
    help [cmd] - print information for specific command
    exit - quit the console

SETTINGS

    port [port] - set the server port
    host [host]- set the server hostname
    file [filename] - write server output to a file
    append [true|false] - true to append to output file or false to overwrite
    terminal - redirect server output back to the terminal

COMMANDS

    config - Set new server configuration properties
    create - Create a new station
    list - List station information in JSON format
    log - Tail log file of station (hit any key to stop tailing)
    remove - Remove a station that is inactive
    save - Save the current set of plots to a ROOT or AIDA file
    set - Set a configuration property
    shutdown - Shutdown the server
    start - Start a station that is inactive
    status - Show server and station status
stop - Stop a station |
You can set the connection settings to the server using the port and host commands, though the defaults should usually work finealso get help for a specific command using:
| Code Block | ||||
|---|---|---|---|---|
| ||||
online> help [command] |
For instance:
| Code Block | ||||
|---|---|---|---|---|
| ||||
online> help create |
This will show you the syntax for using that specific command.
If the server was started with a custom port, or it is running with on a particular hostnameremote host, this these can be specified like:
| Code Block | ||
|---|---|---|
| ||
online> port 1234522222 online> host myactualhostnamelocalhost |
By default, output from the server read by the client is printed to the console, but it can instead be saved to a log file using commands such as:
| Code Block | ||
|---|---|---|
| ||
online> file client.log online> append true |
Configuration of the online reconstruction stations can be performed using the set using command:
| Code Block | ||
|---|---|---|
| ||
# lcsim detector name for conditions online>set lcsim.detector HPS-PhysicsRun2016-Pass2 # run number for conditions online>set lcsim.run 7798 # lcsim steering resource online>set lcsim.steering /org/hps/steering/recon/PhysicsRun2016OnlineRecon.lcsim |
The steering file should contain a Driver that extends the RemoteAidaDriver, in order to provide station plot data to the server.above will configure the stations to run on 2016 data. The detector, run, and steering parameters are all required for running an online reconstruction station.
Once the configuration is set properly, a single station can be created using a command likeA single station with the above configuration can be created using:
| Code Block | ||
|---|---|---|
| ||
online>create 1 |
The argument is the number of stations you want the server to create, which can potentially scale reliably to around the number of cores on your machine.
| Code Block | ||
|---|---|---|
| ||
online>create 8 |
You will need to test how many stations you can run simultaneously, given the specific configuration being used and the number of plots being created/updatedof plots being created/updated at once. The system should roughly scale to the number of cores on your machine, depending on its overall load.
Stations that have been created but not started are in the inactive state. Stations which are inactive have no running system process and no registration entries in the plot aggregation engine that adds plots from different stations, so their plots will not be shown in the remote combined plot tree.
Inactive stations can be started using a command likesuch as:
| Code Block | ||
|---|---|---|
| ||
online>start |
...
Many of the online recon commands are similar in that they take no arguments (usually meaning all stations or all stations in a certain state) or a space-delimited list of station IDs, as in the above example.
Once a station is started, it will process events from the ET ring or sit in wait mode waiting for more data to appearmore data to appear. A station that has been started is said to be in the active state. In order to process data, you would now start the DAQ or the EVIO file producer.
The current status of the stations and the ET ring system can be checked using:
| Code Block | ||
|---|---|---|
| ||
online>status |
Log The log data from individual stations can be streamed from each station using its station ID as an argumentback to the client using a command such as:
| Code Block | ||
|---|---|---|
| ||
online>log 1 |
When streaming log data from one of the stations you can To exit from the log streaming mode, simply hit any key on the your keyboard to exit..
This command will stop all the active stationsStop all jobs:
| Code Block | ||
|---|---|---|
| ||
online>stop |
Stop You may also stop stations by their ID:
| Code Block | ||
|---|---|---|
| ||
online>stop 1 2 3 |
Remove all All inactive stations (active stations need to be stopped first before they are removable).can be removed using:
| Code Block | ||
|---|---|---|
| ||
online>remove | ||
online>remove |
Removing a station deletes its work directory and completely removes it from the online reconstruction server.
Similar to the stop command, you can also remove stations using their IDsRemove stations by ID:
| Code Block | ||
|---|---|---|
| ||
online>remove 1 2 3 |
...
You can use rootbrowse command to look at the plots saved in the ROOT format.
When Finally, when you'll all done, shutdown the server using a command like:
...
This will wait 5 seconds before stopping and destroying all stations and cleanly shutting down the server and its connection to the ET ringand destroying all stations and cleanly shutting down the server and its connection to the ET ring.
| Warning | ||
|---|---|---|
| ||
| You should always stop the server using the shutdown command, rather than killing its system process. Using a command like kill -9 on the server process may result in the system processes for the stations not being deactivated properly, forcing you to kill them manually. |
Now you can connect to the running server using the online recon client:
...
| Code Block | ||
|---|---|---|
| ||
hps-recon-client --host localhost my.cmd |
...
First, install Apache Tomcat and start it (not covered here). I have used the 9.0.41 version..41 release, but any recent version should work fine.
Next, download and build the Online Recon Web AppDownload and build the webapp from github:
| Code Block | ||
|---|---|---|
| ||
git clone https://github.com/JeremyMcCormick/hps-online-recon-webapp cd hps-online-recon-webapp mvn clean install war:war -DskipTests |
Now go to the Tomcat manager webpage, usually which is typically at:
http://localhost:8080/manager/html
Click Choose File in the manager and select the war file at hps-online-recon-webapp/target/HPSRecon.jar which you just built.
Click Deploy to start the webapp. If there is a previous installation of the war file, then first click on Undeploy under Applications to remove it, or this step will fail.
...
| Code Block | ||||
|---|---|---|---|---|
| ||||
<context-param> <param-name>hps.online.recon.connection</param-name> <param-value>//localhost:3001/HPSRecon</param-value> </context-param> |
Should the settings on the AIDA server 's settings be changed, this MUST differ from this, the setting must be updated and the webapp redeployed.
To force a reload of cached AIDA data (e.g. at the start of a new run), click Reload on the webapp in the admin panel:
...
Go to the webpage to view the plots, which would typically be:
http://localhost:8080/HPSRecon/
If there is an error , probably on this page, it is likely that the online reconstruction server is not running.
The plots should show in the frame on the left side of the window:
. They are organized by folders (directories) in the aida AIDA tree.
Click on one of the plots to show it:
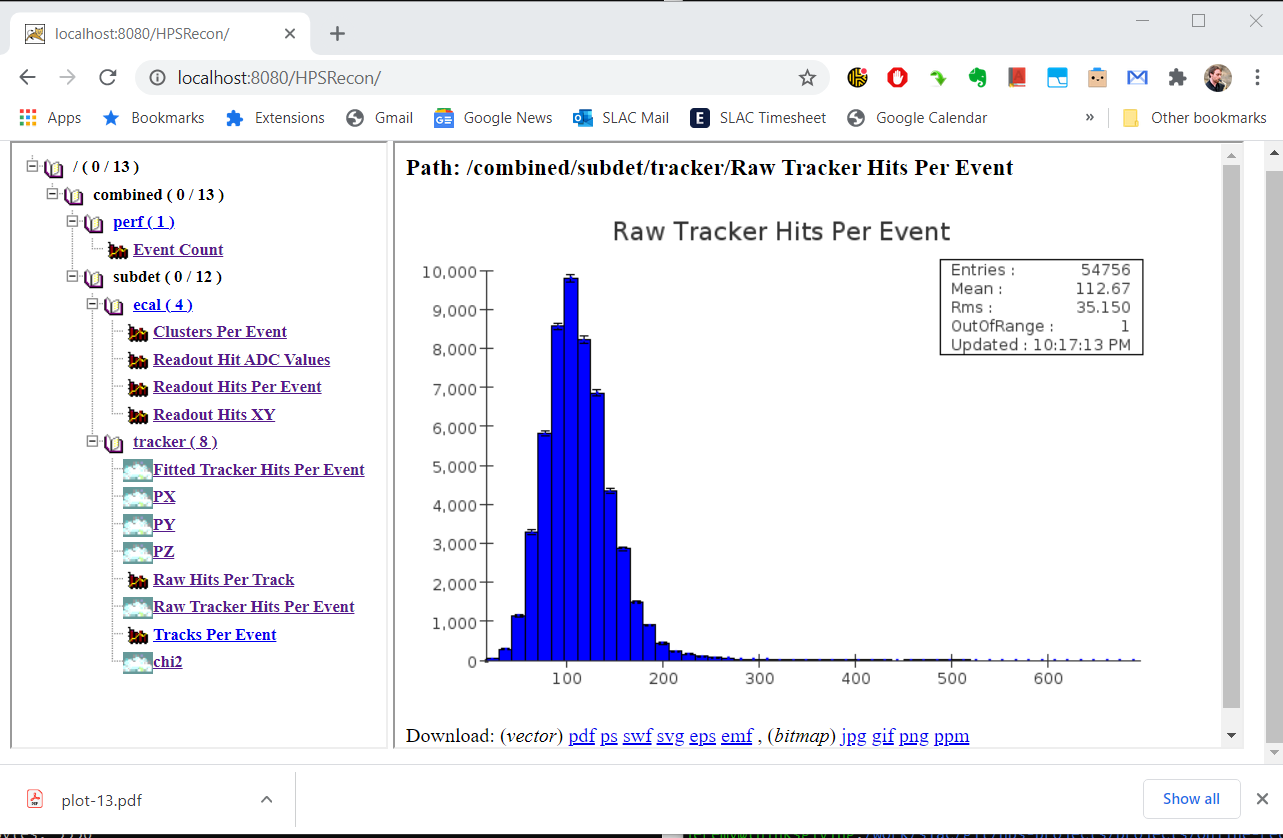
You may also click one of the directories to show a paginated set of thumbnails.
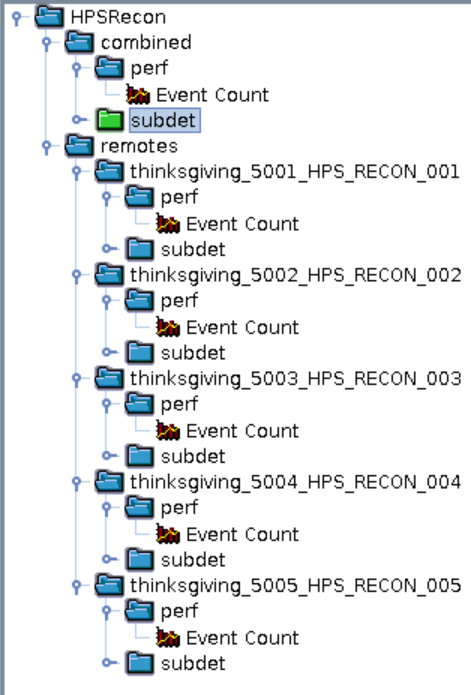
The remote AIDA tree can be viewed in real-time using JAS3 as a client.
Installation of JAS3 is not covered here. You need to install the "Remote AIDA Plugin" from the Plugin Manager as well as the standard AIDA plugin (no other plugins should be required).
Once installed and restarted (ignore any errors from the plugin manager), go to Tools > Remote AIDA > Connect and enter the correct settings for your remote AIDA tree:TODO: graphic here of JAS3 connection params
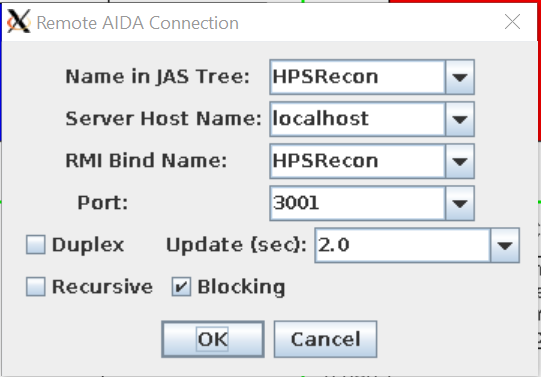
Hit OK to load the remote tree.
These are the defaults but this may differ depending on the server's configuration.
Plots should refresh automatically (every 2s by default).
Click on the combined or remote plots in the tree and style them interactively...
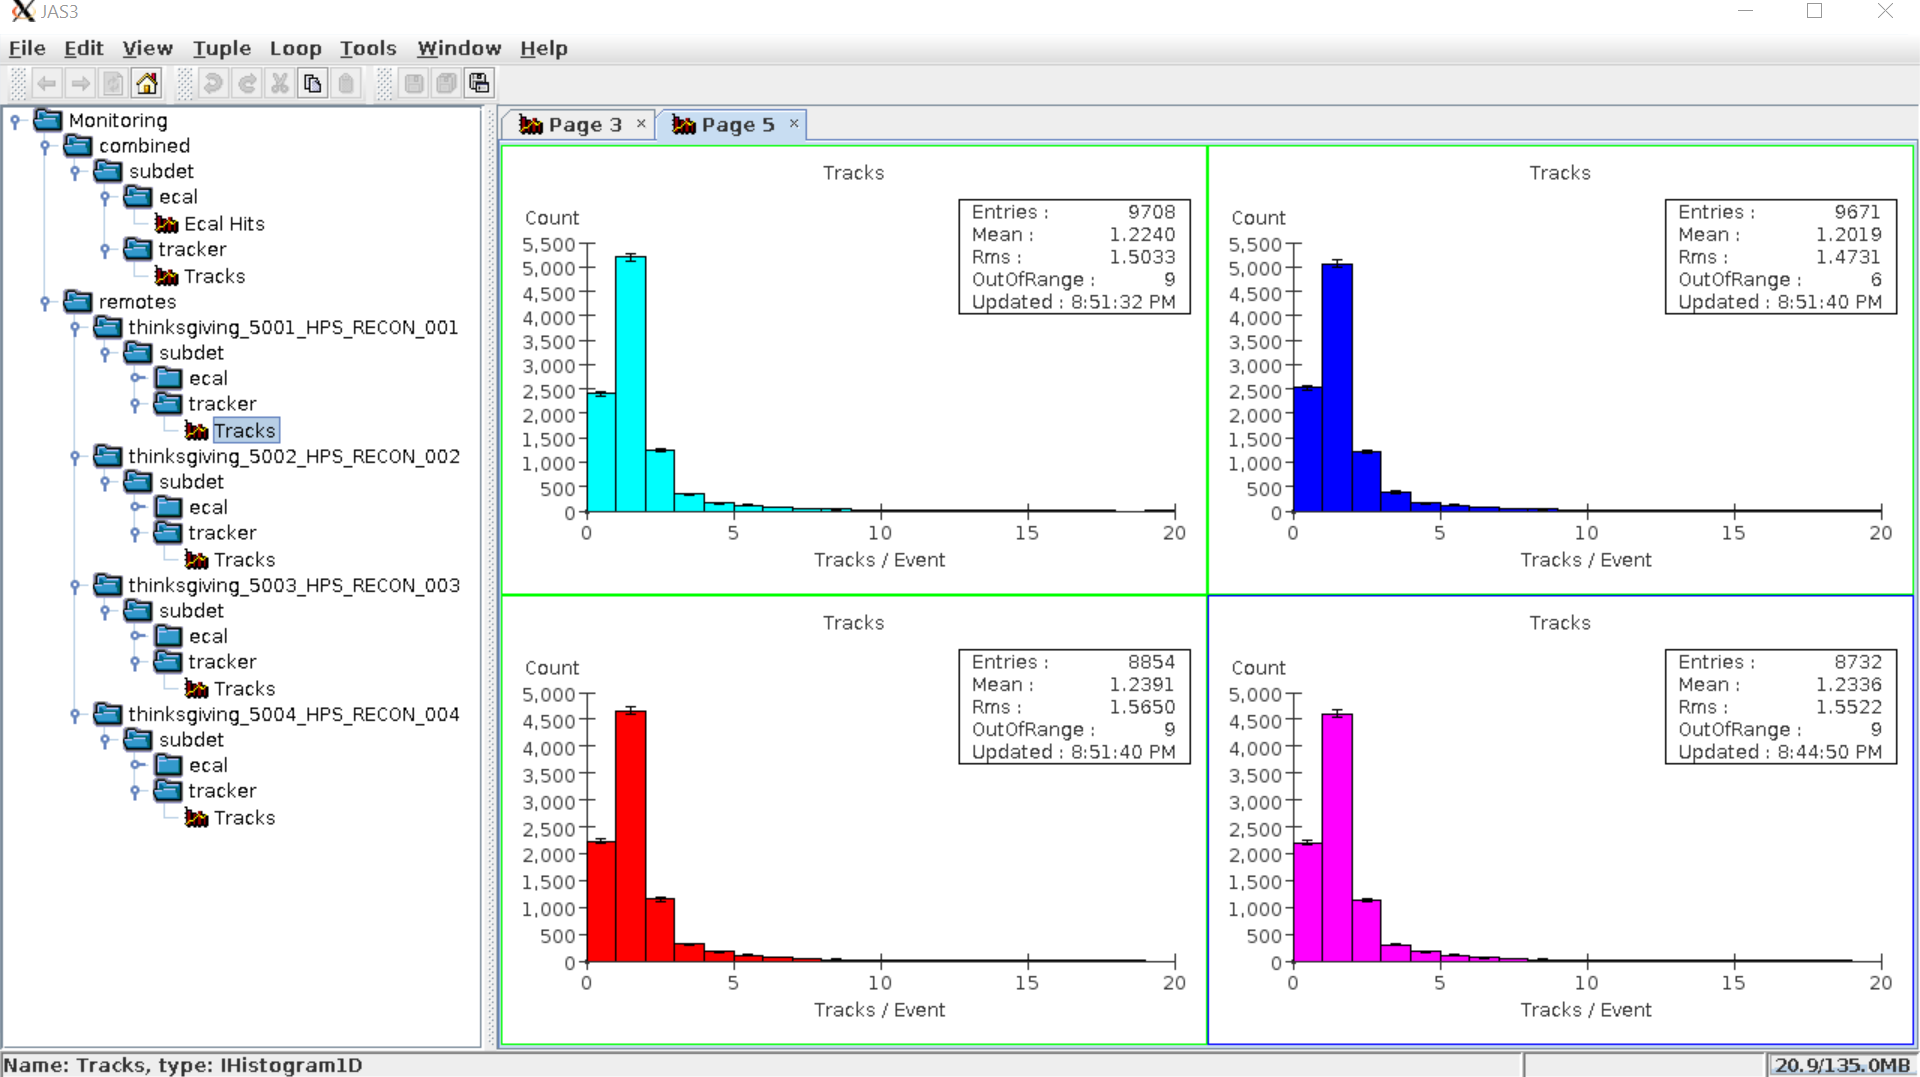
TODO: Run Show how to run a Java main() or Jython script to create AIDA plot pages/regions/styles/etc. from the remote tree data.
If you are running outside Hall B for testing purposes, the CODA ET project software is required for creating running a local ET ring and using a producer to stream EVIO files onto it. (This is not needed for actual data runs in Hall B.)
| Code Block | ||||
|---|---|---|---|---|
| ||||
# downloadDownload and untar sources wget https://coda.jlab.org/drupal/system/files/et-16.1.tgz tar -zxvf et-16.1.tgz # fixFix up build files (for some reason this seems to isbe needed even with Python 2?) cd et-16.1.GIT 2to3-2.7 -w ./coda.py ./SConstruct autopep8 -i SConstruct autopep8 -i coda.py # buildBuild it export CODA=`pwd` scons install # setupSetup the environment (needneeds to be dodone thisevery everytimetime you run) export LD_LIBRARY_PATH=${CODA}/Linux-x86_64/lib export PATH=${CODA}/Linux-x86_64/bin:${CODA}/Linux-x86_64/bin/examples:$PATH |
The scons command may not be present in your environment (installation is not covered here but it should be available in your Linux package manager).
FIXME: The ET installation requires some hacking of the build files. (Checkin to git fork?)
If you are testing and not taking data from a run then you need to start your own ET server to provide EVIO events, Start the ET ring using a command likesuch as:
| Code Block | ||||
|---|---|---|---|---|
| ||||
et_start -rb 8000000 -sb 8000000 -nd -p 11111 -f /tmp/ETBuffer -s 20000 -n 1000 -v -d |
This starts the ET ring on port 11111 and uses a "standard" location for the swap file (buffer).
The -s argument specifics the max event size.
The -n argument is how many events can be present in the ET ring at once (???).
The other settings are mainly to try and improve the network performance of the tool by setting generous read/write buffers and using the TCP "no delay" flag.
Experiment with these to find the settings that seem to work best for your machine.
...
The text file contains a list of EVIO files that should be compatible with the settings on the client/server your configuration settings (e.g. 2016 data for the example settings from above).
These The host, port, and buffer file settings need to match those of used to start the ET start from above or you will not be able to connect.
TODO: Experiment with using broadcast mode to pickup any running ET rings.
...
ring.
x
TODO: Playbook for starting a new run from scratch
...