Instructions
Archiving of online monitoring histograms
...
...
...
...
...
...
...
...
...
...
...
...
Presentations at Beam Spot Meetings:
...
Publishing via DIP
Archiving in PVSS
Meeting Presentations
Joint Online/Offline Beam Spot Meetings
- 04 February 2009 (David)
Beam
...
Separation-Scan Meetings
Plots/Slides on Online Beamspot
Sample slides
Relevant "state of the art" plots
Description | Plot |
|---|---|
Position resolution in X using MC truth information in simulated minimum bias events filtered to pass a L1 trigger | |
Position resolution in Y using MC truth information in simulated minimum bias events filtered to pass a L1 trigger | |
Position resolution in Z using MC truth information in simulated minimum bias events filtered to pass a L1 trigger | |
X position with respect to the nominal beam position taken from beamspot conditions database in simulated minimum bias events filtered to pass a L1 trigger | |
Y position with respect to the nominal beam position taken from beamspot conditions database in simulated minimum bias events filtered to pass a L1 trigger | |
3D surface plot of the measured beam profile in simulated minimum bias events filtered to pass a L1 trigger | |
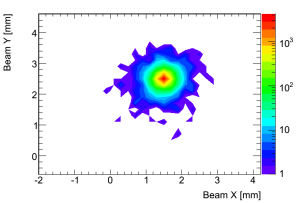
2D surface plot of the measured beam profile in simulated minimum bias events filtered to pass a L1 trigger | |
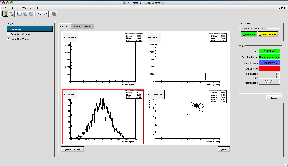
OHP display of all online beamspot histograms present in the Gatherer for simulated minimum bias events filtered to pass a L1 trigger | |
OHP display of the track impact parameter distribution vs. azimuthal angle for simulated minimum bias events filtered to pass a L1 trigger | |
OHP display of a few histograms describing the beam profile in the transverse plane for simulated minimum bias events filtered to pass a L1 trigger | |
OHP display of a few more histograms describing the beam profile in the transverse plane for simulated minimum bias events filtered to pass a L1 trigger | |
DQMD display taken directly from the ACR during a test of the DQMF operation for the beamspot algorithms. This shows the X distribution with respect to the nominal position | |
DQMD display taken directly from the ACR during a test of the DQMF operation for the beamspot algorithms. This shows the X profile of the beam along with fit parameters from the DQM algorithm | |
ATLAS beam conditions (hit rates) panel on which we expect to eventually see additional information coming from the online beamspot algorithm. | |
|
|


...