...
- astro::SkyDir GPS::toSky(const CLHEP::Hep3Vector& latdir, double met)
- CLHEP::Hep3Vector tdir( - (m_currentPoint.rotation() * m_alignment * latdir) );
- void GPS::update(double inputTime)
- //this function calculates all the relevant position and orientation info
- the differences could come from this part of the code
Plots with merit files from run 634002957:
| FT1Ra,FT1Dec direction | FT1CalRa,FT1CalDec direction | |
For each column (either tkr or cal directions) left: log10 of the (RA,Dec) angular separation in degrees for evts with angsep>1e-10 For tkr: 3442 evts out of 2735601 For cal: 2307 evts out of 1806307 right: log10 |Dec diff| vs log10 |RA diff| for the evts with angsep>1e-10 |
|
|
| PtTime distribution for all evts (black) and the ones with angsep>1e-10 (red) |
|
|
| Very weird: some events with Cal angsep>1e-10 have Tkr angsep=0 and vice versa ! |
|


Other important differences with the MeritTuple Pt variables
While answering Seth's request about providing the times of the problematic events, I've started comparing more variables and I've discovered other differences concerns some Pt variables in the MeritTuple:
- PtPos[3] = current orbit position
- PtRax, PtDecx = equatorial coordinates for orientation of S/C x-axis
- PtRaz, PtDecz = equatorial coordinates for orientation of S/C z-axis
As can be seen in the pieces of code below, these variables are a copy of some quantities of the gps object. Unfortunately they do not include the quaternion information.
These quantities are the result of some interpolation between values computed from the FT2 file. So we expect them to change continuously with time. One way to check it is to look at the difference between 2 consecutive events w.r.t. to the delta time between these events:
| 633997253 |
|
| 634002957 |
|

One can see:
- a "main" correlation branch, with clear sub-branches for the PtRaDec x and z directions
- some events with a difference (graph y-axis) = 0
- it occurs often that the quantity does not change during several consecutive events
- some events scattered away from the main branch ()
- they correspond to when the information goes back to normal
The non-differences between consecutive events are not exactly the same between the processing and reprocessing merit files. For the position information for instance:
- processing && reprocessing : 3612 evts
- processing && !reprocessing : 466 evts
- !processing && reprocessing: 464 evts
In one processing flavor, there is not a 100% correlation between the deltas of these variables (delta pos=0 does not imply delta S/C z-axis direction = 0, and vice versa) but if one delta is 0, then the fraction of delta=0 in the other variables is larger.
I've dumped the Merit information in a text file (for the run 634002957, starting at 1st event with (Ra,Dec) diff between processings) with the following information:
1345961 id 7012702 t 634005394.600154 as 0.000000 0.000000 d 1.224745 ft2 d 0.000000 1.224745 x 0.000008 0.000008 z 0.000018 0.000018
- first row = row number in MeritTuple
- id = EvtEvent_Id
- t = PtTime
- as = (Ra,Dec) angsep and cal (Ra,Dec) angsep between processings
- d = PtPos distance between processings
- ft2 d = PtPos distance w.r.t. to FT2 file information for processing and reprocessing
- x = S/C x-axis ang sep w.r.t. to FT2 file information for processing and reprocessing
- z = S/C z-axis ang sep w.r.t. to FT2 file information for processing and reprocessing
If the event is bad (the maximum of as is >0 or if d>0), the line starts with:
- !D! if as=0 and d>0
- !A! if as>0 and d=0
- !B! if both as=0 and d=0
To write the text file, I loop over the merit events, loading the FT2 second information when needed (so that START<PtTime<STOP; and a line is written starting with "Loading new ft2 second") and I write the information as soon as there is a bad events (and also the previous events when we start having bad events) and I stop writing it after 100 good evts in a row (so that we can see these problems mix with the good ones).
The bad events come in bunches but in 2 flavors:
- consecutive bad events (e.g. the first bunch in the text file: 100 bad events in a row)
- occuring right after a new FT2 second has been loaded
- for one of the processing, the Pt variables stick to the values in the FT2 file
- bad and good events mixed together: e.g. second bunch in the text file: ~25 bad events among good ones
- not occuring right after a new FT2 second has been loaded
- the Pt variables don't stick to the values in the FT2 file (but it doesn't mean that they agree between processings)
The main conclusion is that there is something wrong regarding the PtVariables , possibly related to the FT1 Ra,Dec direction of the events, in both processings !
...
Related pieces of code:
AnalysisNtuple/src/PointingInfo::execute( const astro::GPS& gps)
- start = gps.time();
- CLHEP::Hep3Vector pos_km = gps.position();
- CLHEP::Hep3Vector location = 1.e3* pos_km;
- sc_position[0] = location.x(); sc_position[1] = location.y(); sc_position[2] = location.z();
- ra_zenith = gps.zenithDir().ra(); dec_zenith= gps.zenithDir().dec();
- ra_scx = gps.xAxisDir().ra(); dec_scx = gps.xAxisDir().dec();
- ra_scz = gps.zAxisDir().ra(); dec_scz = gps.zAxisDir().dec();
The interpolation is performed during in void GPS::update(double inputTime)
- // if history, just ask the history to interpolate the table, or whatever
- if(m_rockType == HISTORY || m_rockType == HISTORY_X_EAST ){
- m_currentPoint = (*m_history)(inputTime);
The last command is defined in const astro::PointingInfo& PointingHistory::operator()(double time)const throw(TimeRangeError)
- m_currentPoint = h1.interpolate(h2, prop, time);
where m_currentPoint contains the following quantities:
- CLHEP::Hep3Vector m_position; ///< position (km)
- Quaternion m_q; ///< orientaion of the SC: xaxis direction
- EarthCoordinate m_earth; ///< Earth position: (lat, lon)
The interpolation is done independently for these quantities (see Seth's comment on the quaternion interpolation)
...
More on Pt variables and the question on correlation with Ra,Dec difference primary problem
The following plots show the time of problematic events (either Ra,Dec diff between processings or evts with PtPos or S/C x or z axis identical to prev evt). One can clearly see that there is no 100% correlation between these problems.
I was misled by run 634002957 and the corresponding txt file in which I wrote information starting from the first evt with Ra,Dec diff between processings. So I missed all the evts with PtPos or S/C x or z axis identical to prev evt at the beginning of the run for which there is no Ra,Dec diff between processings.
But nevertheless some spikes do correspond. And the spikes in the pro and repro plots are not identical, showing a different behaviour in the original and new processings.
633997253 x-axis = PtTime-start of run 1st row: evts with Ra,Dec diff between processings 2nd row: evts with same PtPos as prev evt (pro) 3rd row: evts with same PtPos as prev evt (repro) 4th row: evts with same S/C x-axis as prev evt (pro) 5th row: evts with same S/C x-axis as prev evt (repro) 6th row: evts with same S/C z-axis as prev evt (pro) 7th row: evts with same S/C z-axis as prev evt (repro) |
|
| 634002957 |
|


...
Comparison of Pt variables with home-made FT2 interpolation
Using the FT2 information, one can predict/interpolate the distance w.r.t. to the position at START and the angular separation w.r.t to the direction at START:
- PtPos
- compute the distance between SC_POSITION at START and at STOP (=START of next event)
- multiply this distance by PtTime-START
- S/C x-axis and z-axis:
- compute the angular separation between S/C direction at START and at STOP (=START of next event)
- multiply this angular separation by PtTime-START
The following plots shows the absolute difference between the measured and predicted quantities:
633997253 left: pro right: repro each variable is computed w.r.t. to ft2 value at START (e.g. the measured pos dist is the distance between the event PtPos and SC_POSITION at START) |
|
| 634002957 |
|

One can see the outliers come in bunches. A lot of bunches are common between pro and repro but some are different.
The pos dist and S/C ang sep outliers are 100% correlated. The most convenient way to detect them is to select abs(pos dist to ft2: diff with interpolation)>1m.
...
Since we don't know yet whether the FT1 difference is 100% related to the interpolation problem, a separate confluence page to discuss the latter has been created : Bad interpolation of FT2 information during processing
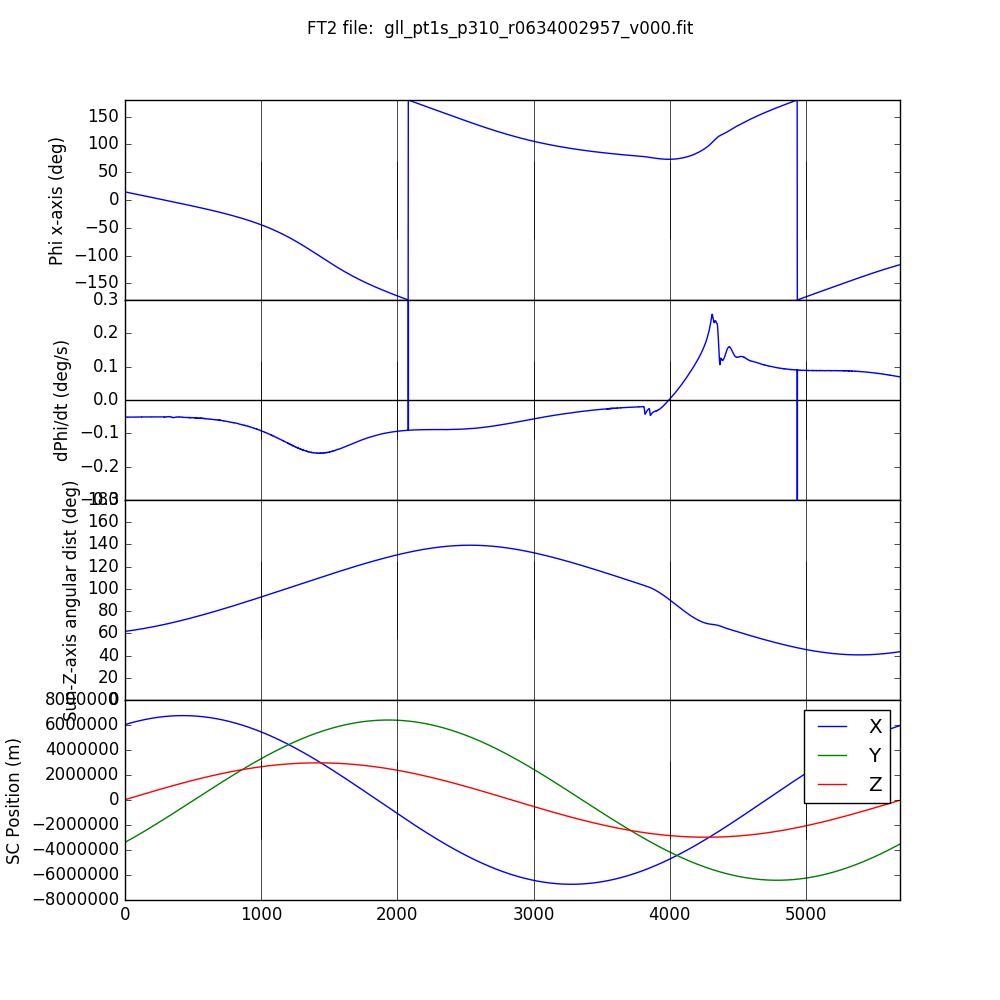
(SD, 16 Feb 2021) Here is a quick summary of some information in the ft2seconds files for the two runs Philippe reports on above. I was curious to see if the broad periods of increased fraction of events with 'stuck' spacecraft X and Z axes corresponded with any special part of the orbit (since they look periodic in Philippe's plots). I was especially interested to see if they corresponded to periods when the spacecraft was rotating most quickly around the Z axis. The angle Phi in the plots below is derived by rotating the SC_Rax and SC_Decx to a coordinate system that has SC_Raz, SC_Decz as the pole, with Phi = 0 corresponding to RA = 0. (Big jumps in Phi correspond to wrapping around +/-180 deg.) The first panel below is Phi. The second is the rate of change of Phi. The third is the angular distance between the Sun and the LAT Z axis. The fourth panel is just the SC_POSITION components. The times are seconds since TSTART, as in Philippe's plots. The vertical lines are at 1000 s intervals, also as in his plots.
I can't say I see any compelling correspondence with Philippe's plots. Note that these runs are on successive orbits. Each started and stopped with the ascending node crossing the equator.
| 633997253 |
|
| 634002957 |
|

(SD, 22 Feb 2021)
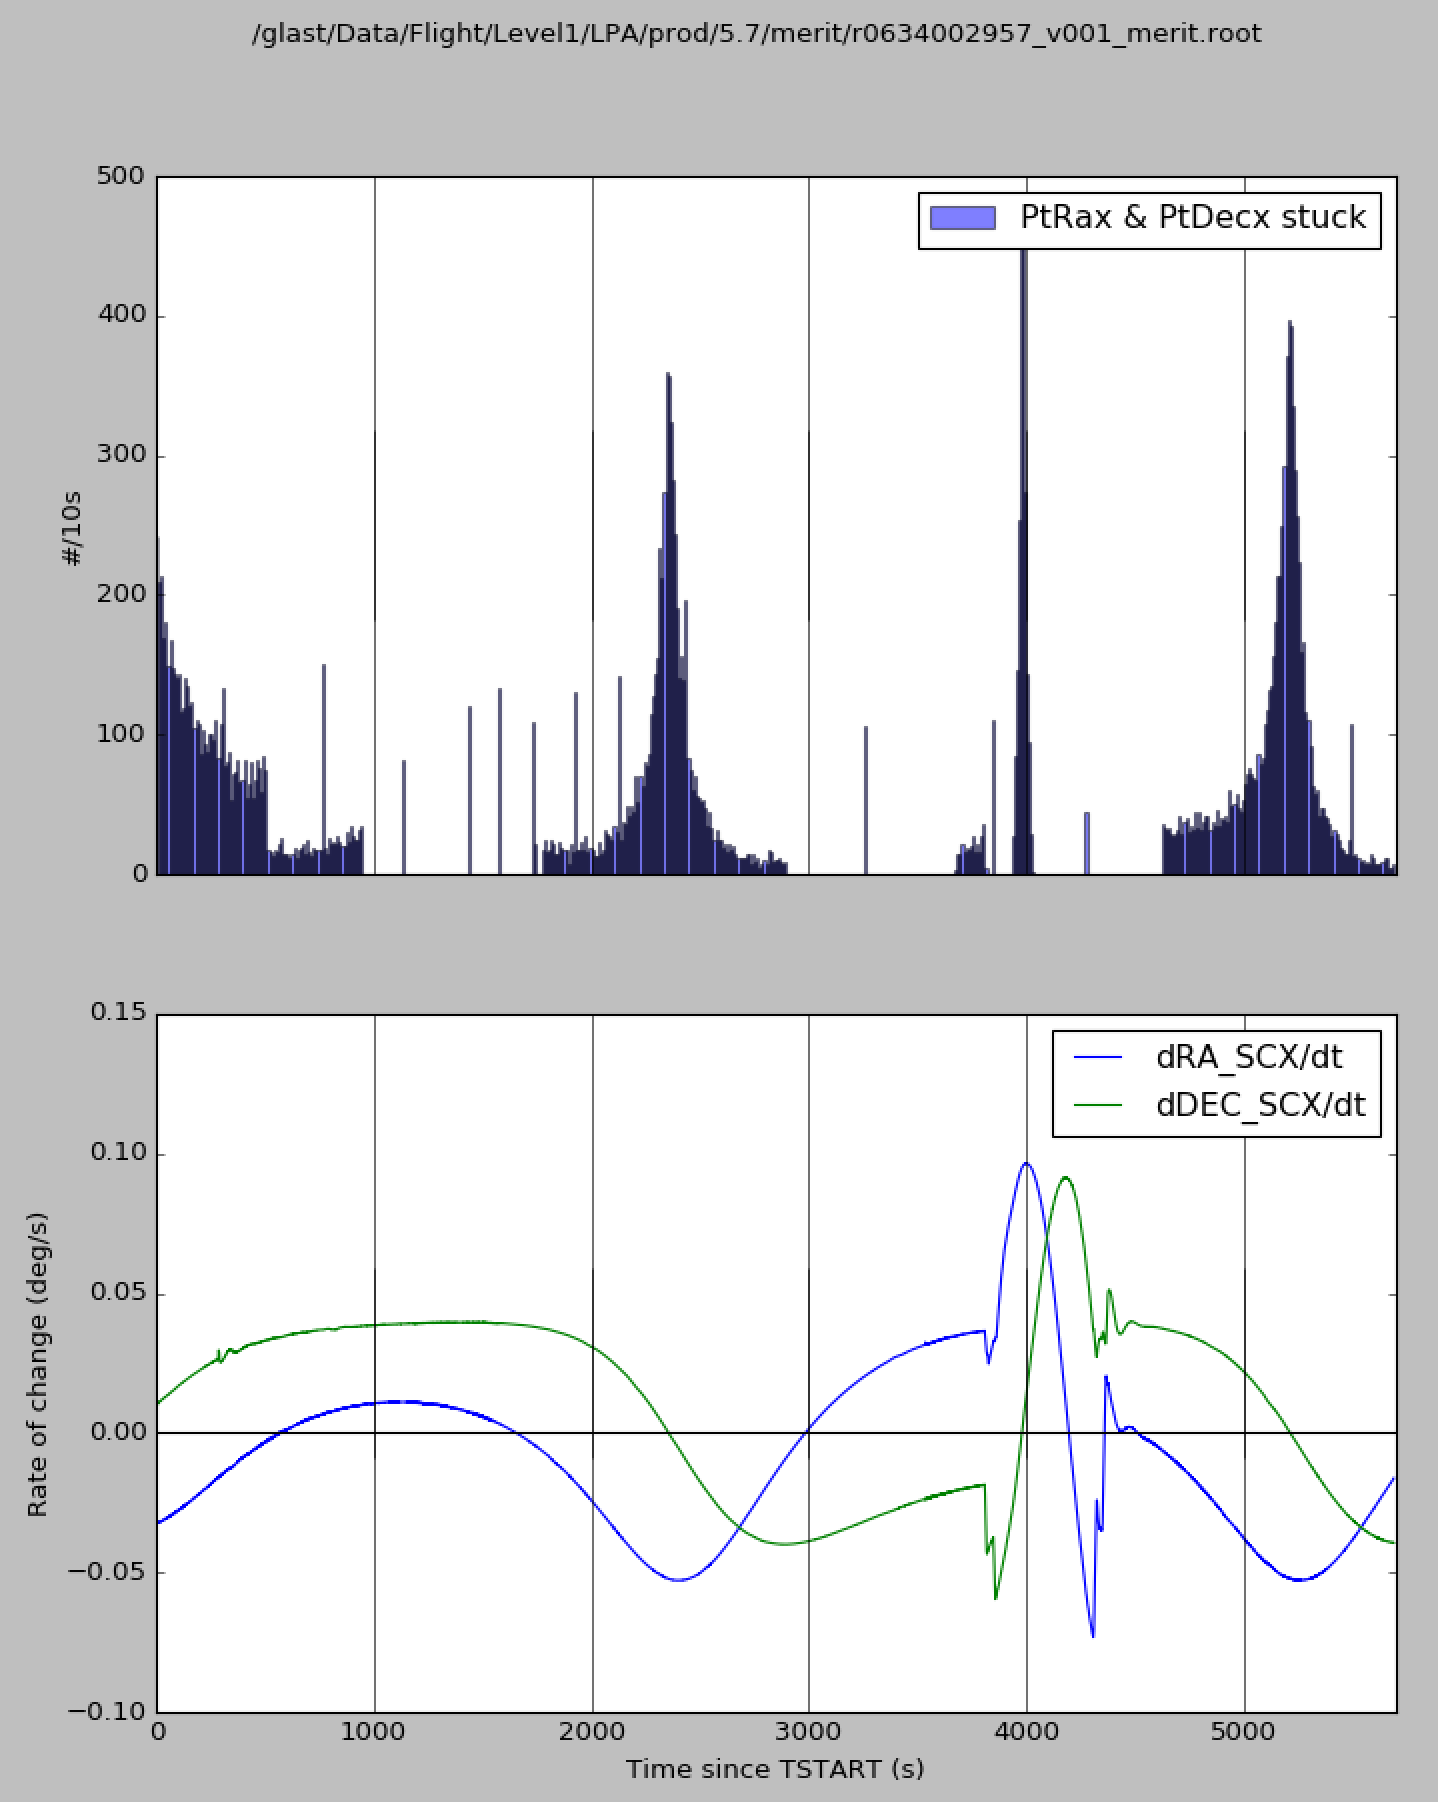
The broad features indicating 'stuck' spacecraft pointing directions in Philippe's plots above seem to indicate just conditions when the coordinates are in fact not changing very quickly and successive events can in fact have the same reported spacecraft orientation. Here is a comparison of the rate of events with the same PtRax and PtDecx as the previous event in the Merit file with the rates of change of RA_SCX and DEC_SCX from the pointing history file for r0634002957_v001_merit.root and gll_pt1s_p310_r0634002957_v000.fit. The histogram in the upper panel is consistent with Philippe's (with different binning in time). The broad peaks correspond to times when DEC_SCX in particular is changing only slowly. This indicates that the broad features in the 'stuck' pointing plots are not an issue with the interpolation. (I get different profiles from Philippe's plot for PtRaz and PtDecz but I think the same explanation applies for 'stuck' spacecraft orientation for them as well.)