...
This is the rh9 v rhel4 smackdown edition of GlastRelease reports. (See this validation page.)
Comparisons are for running v17r34p0 using the rh9_gcc32opt and rhel4_gcc32opt builds on rhel4 linux32 nodes.
...
The BackGndMixDC2 test shows many plots as different. These stand out to me:
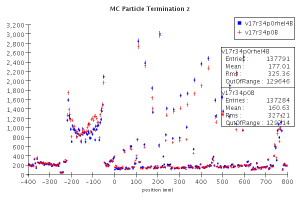
MCTERMZ (Z distance of MC particle termination) | MCTERMZ for 1 GeV Proton Test |
|---|---|
| |
POSENERGYDEP (MC position hit deposited energy) | |
| |
TKRHITACTDIS (Active Distance for tracker hits) | |
|
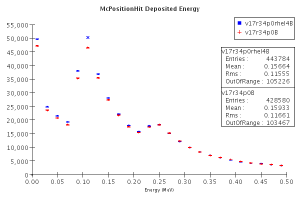
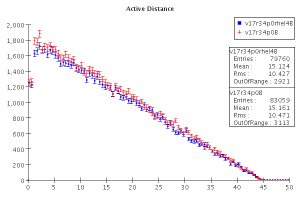
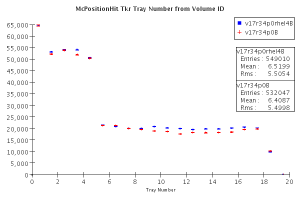
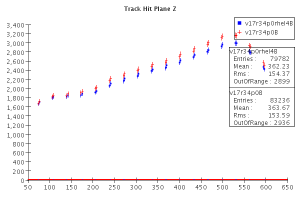
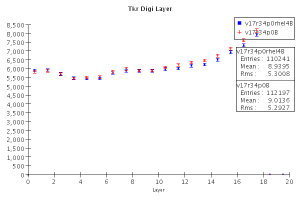
The plots below seem to tell the same a similar story, somewhat less hits in the tracker for the rhel 4 run, which as Richard points out has the higher number of CrElectronSplash and CrElectronPrimary, and less CrProtonPrimary. There are more position hits at low energy for the rhel 4 run.
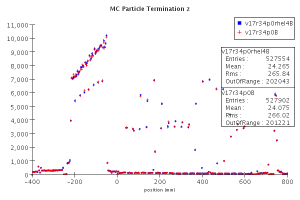
POSMCTKRTRAY (tracker tray numbers with position hits) | TKRHITPLANEZ (Z distance of tracker hit planes) |
|---|---|
|
|
TKRLAYER (hits in tracker layers) | |
|
Looking through things and noting some plots that don't change in some of the tests
I'm becoming more convinced that this can all be due to the fluctuations between shifts among the input particle populations.
Here is the breakdown of TkrHitsInLayer for each of the broad subspecies:
TkrHitsInLayerNN (All, top points; overlap sample, bottom points) | TkrHitsInLayerNN by species |
|---|---|
|
|
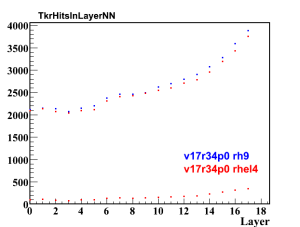
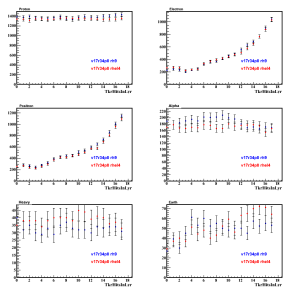
Note that when I select events with the same energy/particle type/direction the tracker hits by layer distribution is identical (lower red points in above left plot) for the rh9 and rhel 4 runs. This also suggests that similar particles are treated the same for both builds and that it is only the input differences that are skewing the distributions.