...
Introdudction
Hansen, Jerrod E <HansenJE@state.gov> sent email 12/5/2012 requesting:
...
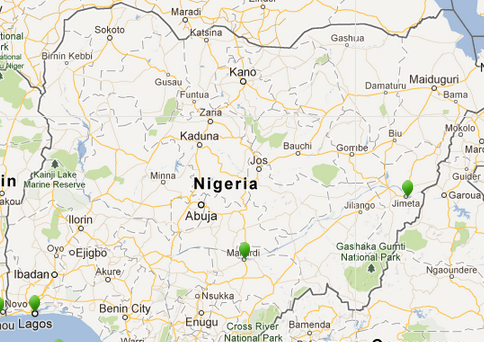
Their locations are shown in the map below:
Nigeria Minimum RTT
The minimum RTT measured from SLAC to the Nigerian hosts are seen below:
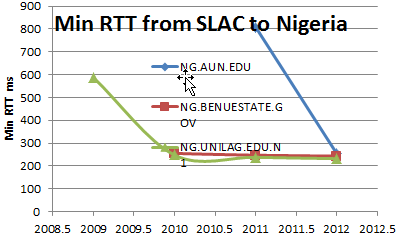
Minimum RTTs > 450ms usually indicates taht the link went via Geostationary Satellite. It is seen that NG.AUN.EDU transitioned to a terrestrial link in 2012, while NG.BENUESTATE.GOV transitioned in 2010.
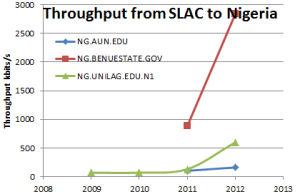
Nigeria Throughput
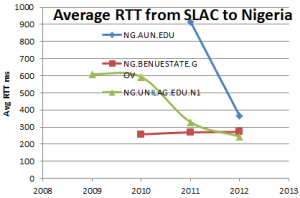
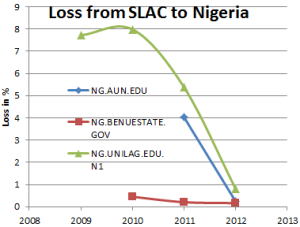
The maximum TCP throughput can be roughly estimated from the loss and average RTT using the Mathis formula. the three metrics are seen in the table below:
Average RTT | Loss | Derived throughput |
|---|---|---|
| | |
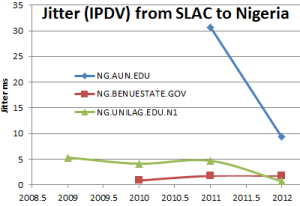
Nigeria Mean Opinion Score (MOS)
The MOS is a subjectiveness of the quality of speech developed by the Telecommunications industry. 5 is perfect HiFi, 1 is can't hear anything useful. Above ~3.6. is usable. The MOS can be derived from the RTT, jitter and loss.
|
|
|
|
|---|---|---|---|
| | | |
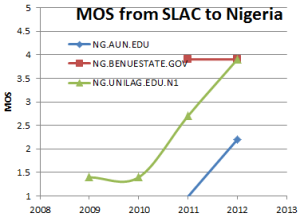
It is seen that VoIP calls from SLAC (Stanford University, California, USA) became feasible in 2012 to NG.AUN.EDU and NG.BENUESTATE.GOV.
Nigeria vs. the rest of Africa
The chart below (and spreadsheet here) shows the derived throughput for the various African regions.
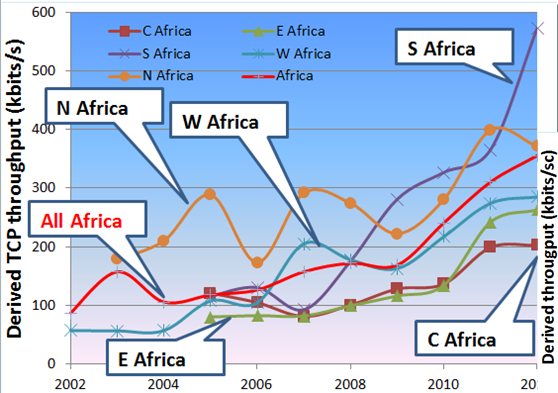
Comparing the median throughput seen from SLAC for W. Africa with that for Nigeria in the table above, it is seen that NG.AUN.EDU is worse off, NG.UNLILAG.EDU is slightly better off, and NG.BENUESTATE.GOV is much better off.
Africa vs the rest of the world
Comparing the through put of African regions with the rest of the world, one gets the chart below:
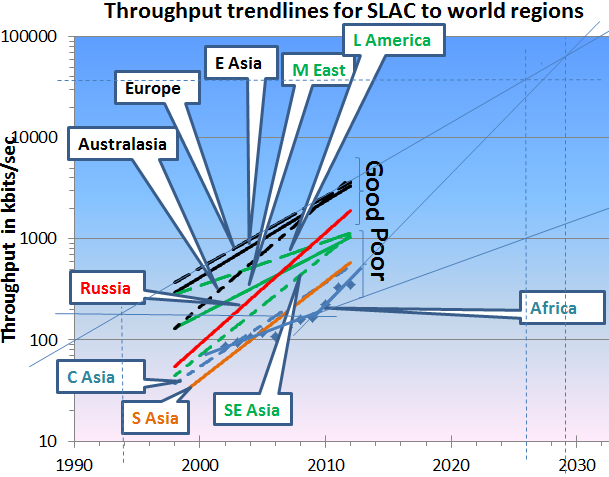
It is seen that Africa is much worse than the rest of the world. If one extrapolates back in time from where Africa was in in 2008 (before the world cup and the installation of multiple subsea fibre optic cables to Sub-Saharan Africa) then one see African performance was roughly equivalent to that of Europe in 1994. Not only was Africa behind Europe by 14 years, but it was falling further behind year by year, such that by 2026 it would have been almost 40 times worse than Europe. On the other hand if one assumes the trend in African throughput since 2008 continues, then Africa could catch up with Europe by by 2028.