...
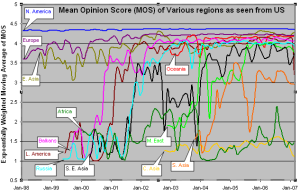
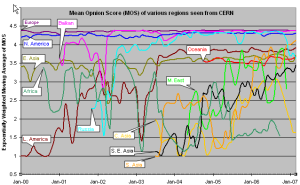
Most tool-based solutions calculate what is called an "R" value and then apply a formula to convert that to an MOS score. Then the R to MOS calculation is relatively standard. The R value score is from 0 to 100, where a higher number is better. To convert latency, loss, and jitter to MOS we follow Nessoft's method. The graphs below shows the Exponentially Weighted Moving Average (using EWMI i = alpha * EWMI i-1 + (1 - alpha) * Obs i where alpha = 0.7 and EWMI 1 = Obs 1) for the MOS as seen from the W. Coast of America (SLAC) and Switzerland (CERN). N.B. MOS values of one are reported for heavy loss (loss > 40 %).
| |
|
...
Mean Opinion Score as seen from the US | Mean Opinion Score as seen from CERN | Mean Opinion Score as seen from Europe |
|---|
CERN monitors fewer remote hosts than SLAC (56 versus over 400) so the data is not as complete in the CERN case. Comparing the two graphs, it can be seen that, as expected, the MOS is better for the shorter distances (i.e. CERN to Europe is better than SLAC to Europe, SLAC to N. America is better than CERN to N. America.).
...
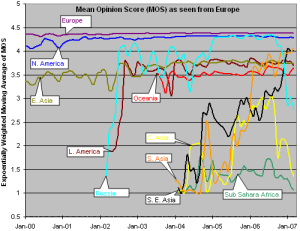
The third graph shows the Mean Opinion Score (MOS) from Europe two various regions. We have five monitoring sites in Europe (one at CERN, one at ICTP, one in Germany, and two at UK. The improvement in Latin America and Russia in 2002 is the result of shift from satellite to fiber. The drop for Russia in Sep, 2006 is because we installed a new version of PingER and it started monitoring 9 hosts in Russia whereas previously it was monitoring 20 hosts. For Central Asia the number of sites went up from 3 to 15 in Sep 2006, so the latter results are a better indication of the overall performance of Central Asia. For Sub Sahara Africa the coverage improved in Sep, 2006 (increased from 8 to 39 sites). So for sub Sahara Africa the results after Sep 2006 presents a better picture. South Asia as seen from Europe is performing better than as seen from US because MOS is derived from average RTT which is distance dependent.