...
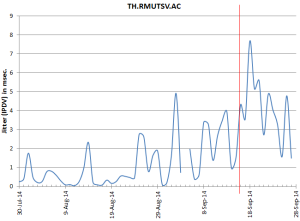
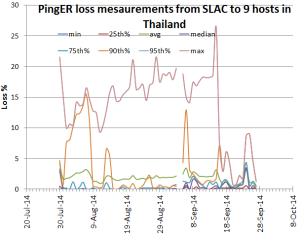
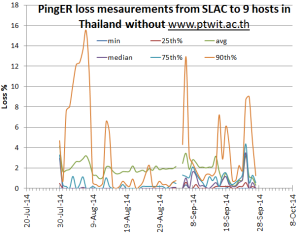
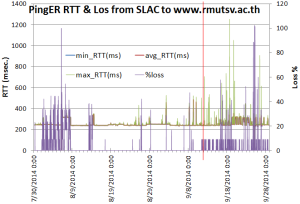
Similarly evidence is inconclusve for losses, in fact if one looks at the maximum losses it seems to decrease on September 15th. However this is probably misleading since we stopped being able to make measurements to www.ptwit.ac.th on September 15th and this host had consistently the highest losses prior to September 16. Removing this host we get the next graph. If we then focus on the Thailand host (www.rmutsv.ac.th) showing the most impact around September 15th we get the 3rd graph below. Looking at this there is some evidence that there was a change in the jitter of the RTT following Sptemer 15th (red line)
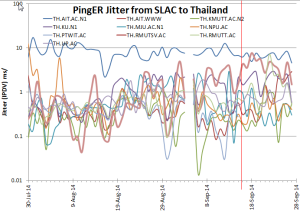
Looking at the jitter (measured as the Inter Packet Delay Variability IPDV) for the Thailand hosts seen from SLAC we get the graph below (rmutsv is identified as the thicker line. We use a log scale to enable visibility of a wider range of values. The graph to the right just show rmutsv but this time on a linear y axis.