...
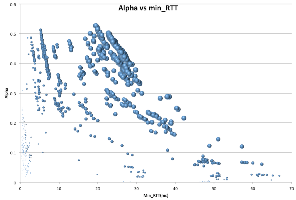
We loaded the two pingtable metrics into an Excel spreadsheet and used the Excel vlookup function to get the 2 metrics for each pair of hosts (monitor-remote host pairs). We then scatter plotted alpha (y) versus min_RTT (x in msec). This is shown in the plot below:
Alpha vs min_RTT | Bubble area = distance between monitor & remote |
|---|---|
| |
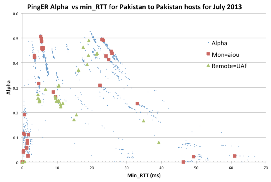
The red dots are the points for monitor AIOU, the green dots are for the remote UAF. The downward sloping lines are for monitor-remote hosts separated by roughly the same distance, e.g. monitors and remotes in Karachi and Lahore.
...