...
The MIP peak values exhibit no systematic drift. The plots below shows a histogram of the slope of the trend line (The left in units of MIP's per year, and the right in units of raw PHA per year).
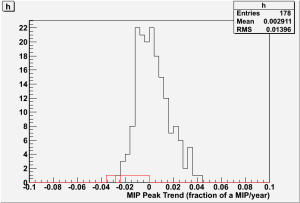
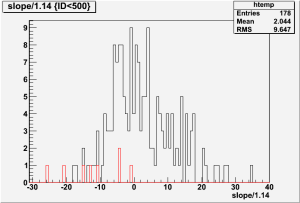
As is apparent from the plots the
...
The MIP peak values exhibit no systematic drift. The plots below shows a histogram of the slope of the trend line (The left in units of MIP's per year, and the right in units of raw PHA per year).
As is apparent from the plots the