Introduction
This document is a case study on the inter-regional connectivity of Eastern Asia. The figure - Eastern Asia - depicts the countries considered to be part of East Asia. These are China, Japan, North Korea, South Korea, Mongolia and Taiwan.
...
Here we study the current capacity, infrastructure and opportunities that the users of these countries have to access the Internet. Followed by that we analyze the Internet performance as measured by the PingER project in comparison to the world and neighbouring countries. Later we compare the performance statistics to the Human Development Indices.
Current circumstances
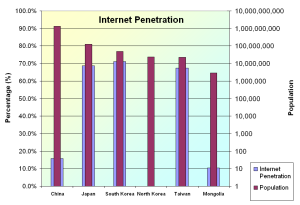
As shown in the following two figures, currently, Asia contributes approximately 40% of the Internet users towards the total. Among these 40%, the major contributors are some of the East Asian countries such as China, Japan, South Korea and Taiwan. (source: Internet World Stats)
...
|
Summary of |
|---|
International Bandwidth for East Asia
The international bandwidths for China, Japan, North Korea, South Korea, Mongolia and Taiwan are shown in the figure below - International bandwidth. The statistics have been collected from Mike Jenson 10/18/07 - International bandwidth by country, Internet World Stats and ITU. They clearly show two groups of countries; those which have reasonable available resources (such as Japan ~100 Gbps aggregate, South Korea ~ 50 Gbps, Taiwan and China ~100 Gbps aggregate) and those which are lagging far behind (such as Mongolia and North Korea). North Korea is not known to have public internet access in general. Also, information about Internet connectivity is unavailable, however, N. Korea is known to have an internet cafe maintained via a satellite connection.
...
The central projection of the Global Internet Map 2006 shows the international internet bandwidth and is scaled by capacity. The map also shows color-coded tags, indicating the number of internet hosts per 10,000 people. Each country is color-coded according to the extent of international internet bandwidth available. The maps of central projection and international bandwidth usage per country were prepared by TeleGeography.
PingER and Internet Performance
Pinger Coverage
| Include Page | ||||
|---|---|---|---|---|
|
...
| Monitoring | Beacon | Remote |
|---|---|---|---|
Japan | 1 | 1 | 9 |
China | 2 | 1 | 7 (east) |
South Korea | 1 | 1 | 4 |
Mongolia | 0 | 1 | 0 |
Taiwan | 1 | 1 | 0 |
North Korea | 0 | 0 | 0 |
Worldwide Comparison
| Include Page | ||||
|---|---|---|---|---|
|
MOS for various Regions
| Include Page | ||||
|---|---|---|---|---|
|
Information on Calculation MOS can be found here.
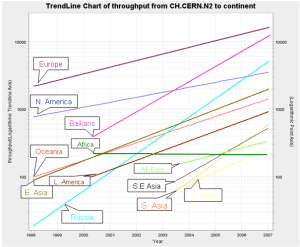
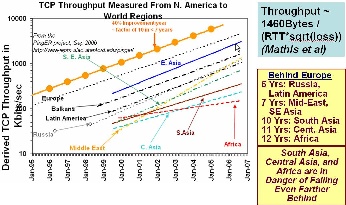
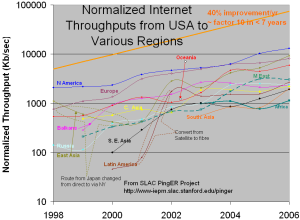
TCP throughput from CERN & SLAC to World Regions
| | |
Throughput trends as | TCP throughput as seen | Normalized Internet throughput |
|---|
...
It is important to look at the aggregated statistics mentioned above in the light of International bandwidth possessed by the East Asian countries as shown below.
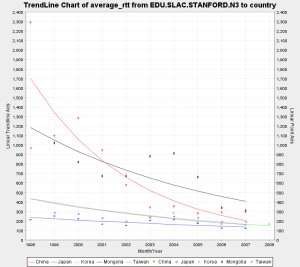
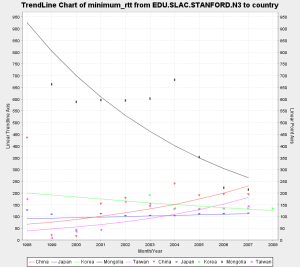
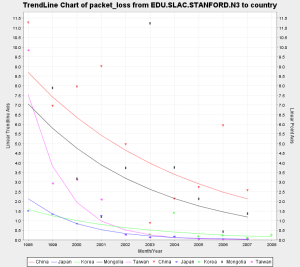
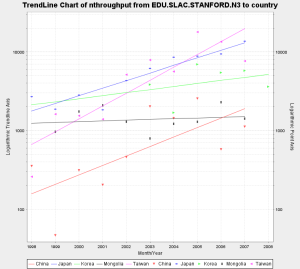
Packet Loss, Minimum RTT and Throughput
| | | |
Average RTT (as seen | Minimum RTT (as seen | Packet Loss (as seen | Throughput (as seen |
|---|
...
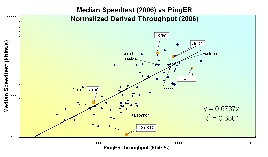
|
Median Speedtest vs PingER |
|---|
Routing
For the sake of reference, the figure below shows major international traffic routes and the submarine cable map. Domestic routes are omitted. The source is TeleGeography research.
...
The anomalous behaviour of traffic to selected nodes/networks may be attributed to the BGP policies enforced by ISPs.
Comparison with Human Development Indices
There are many indicators of countries' development from organizations such as the International Telecommunications Union, the United Nations, the CIA, the World Bank try to classify countries by their development. They are quite challenging and require careful consideration of: what can be measured, how useful is it, how well it is defined, how it changes with time, how it changes from country to country, the cost of measuring, the time it takes to gather (to avoid being too out of date, how subjective they are etc.
Typically they are based on some combination of GDP, life expectancy, literacy, education, phone lines, Internet penetration etc. Some examples include the Human Development Index (HDI), the Digital Opportunity Index (DOI), the Opportunity Index, the Technology Achievement Index etc. In general agree with one another (R 2 ~ 0.8). More information can be found here. For this report we focus on just two, the DOI (since it is recent and covers more countries than most) and the HDI since it different from the others and focuses on the human condition.
...
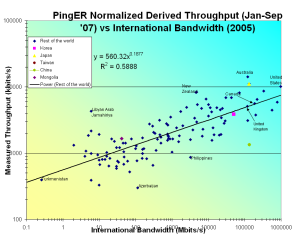
|
International bandwidth (2005) |
|---|
Conclusions
(The conclusions may not be in the order of importance)
...