...
The summarized results shown in the graphs above feature interesting conclusions.
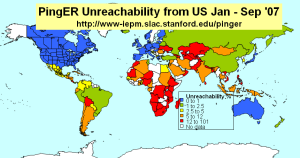
We observed that average RTT values for different sites in China vary significantly, however the minimum RTT values tend to agree with those of their peers which is understandable. Also, the difference between the minimum RTT and average RTT is significantly large for most of the sites. Additionally there are large variations in the jitter values measurements for these sites. These observations allow us to conclude that there is considerable amount of congestion within China. Also there are huge packet losses (5% - 17%) for few sites as shown in the figure above - Unreachability, Loss and Throughput - where as the . The rest show nearly acceptable results of less than 2.5% losses and similar (derived TCP) throughput values of approximately 900 Kbps. It is important to note that the sites with large variations in jitter and large difference between avg. RTT and min. RTT also show significantly less throughput, and more packet losses as compared to their peers.
Below are the aggregated performance results for the individual sites as seen from SLAC for the year 2007.
The avg. RTT and min RTT measurements for Japan and Taiwan agree very strongly among themselves. Also the difference between avg. RTT and min RTT is minimal. The jitter is nearly negligible. The throughput measurements seem to agree with each other, the packet losses are nill. These results allow us to conclude that the network performance for Japan as well as Taiwan (as seen from the US) is excellent. One particular site shows relatively larger jitter and unreachability measurements which we think is a trait of the monitoring site and not the network in general.
As in the case of Japan, the avg. RTT and min. RTT measurements for South Korea agree strongly with each other and the difference between them is consistently that of 25 ms (approximately). The packet losses are within the acceptable range. Also, the average throughput is relatively good (3900 Kbps) as seen from the US. Considering each site independently, we observe that a particular monitoring site (i.e of Kyung Hee University) shows excellent results as compared to its peers, with minimal jitter and losses and relatively large (derived TCP) throughput values. The other sites, however show jitter of about 6 ms which is acceptable. Thus we conclude that the internet network of South Korea features minimal congestion.
Mongolia in comparison to all the above shows lower (derived TCP) throughput measurements which is understandable considering the international bandwidth and ratio of users to available resources. The difference between the avg. RTT and min. RTT, as well as the large jitter values encourages us to conclude that there is fair amount of congestion within Mongolia. Interestingly though there are negligible packet losses.
Below are the aggregated performance results for the individual sites as seen from SLAC for the year 2007.
| | | |
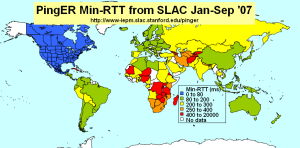
min RTT as seen by PingER | |||
|---|---|---|---|
| | | |
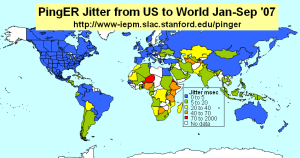
min RTT as seen by PingER | Jitter as seen by PingER | Normalized Derived Throughput | Unreachability as seen by |
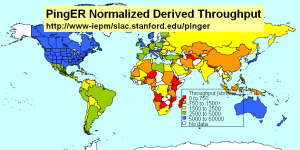
To verify whether the order of magnitude of the normalized derived throughput is correct we compare it with the Speedtest results. This application sends a known amount of data between your computer and servers in Australia. Then it measures throughput and besides returning the result to the user, it also saves and makes available the results by country and ISP. The correlation is shown in the figure below. The orders of magnitude of the two methods agree and there is a strong correlation.
...