...
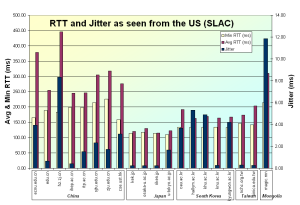
Round Trip Times are measurements which are influenced by the distance between the sites. We know that the distance between SLAC (California, USA) and observed nodes in East Asia is about 12,000 Km. Knowing the speed of light in fibre (roughly 0.6*c, we use 1ms. delay is equivalent to 100km) and considering the submarine cable map (discussed in the section titled Routing) the minimum RTTs for Korea and Japan are within the 'acceptable' (125 - 250 ms) and 'good' (82.5 - 125 ms) range respectively. Significant improvements were http://www-wanmon.slac.stanford.edu/cgi-wrap/pingtable.pl?file=minimum_rtt&by=by-site&size=100&tick=allyearly&from=EDU.SLAC.STANFORD.N3&to=Korea%2C+Rep&ex=none&dataset=hep&percentage=anyobserved for South Korea after 2003. Since then S. Korea and Japan http://www-wanmon.slac.stanford.edu/cgi-wrap/pingtable.pl?file=minimum_rtt&by=by-site&size=100&tick=allyearly&from=EDU.SLAC.STANFORD.N3&to=Japan&ex=none&dataset=hep&percentage=anyboth have maintained their RTT measurements below 150 ms .
Measurements for China and Taiwan however show results in the years 1999 and 2000 (and 2001 for Taiwan) which do not agree with the constraints of nature. For these years the results (figure - Minimum RTT) show measurements of less than 100 ms which is not possible considering the speed of light in fibre and the distance between the observing (USA) and observed (China & Taiwan) nodes. We believe that the reason for this is that the observed nodes did not exist where they were expected to be. The nodes accessed for China and Taiwan were probably proxy nodes deployed somewhere in the US. Thus disregarding the years 1999-2001, the measurements for China are observed to be within the acceptable range (i.e. of less than 250 ms). These measurements however seem to increase slightly at a negligible rate of 0.007%. This may be attributed to the difference in rate of increase for the annual user growth i.e. 53.3% as compared to the increase in bandwidth resources i.e. 43.7%. Similarly for Taiwan, disregarding the measurements taken in 1999-2001, the results are found to be in the acceptable range and are maintaining themselves.
As a consequence of consistent government policies since 1994 and support from Asian Development Bank results for Mongolia have improved significantly i.e. from greater than 550 ms to less than 250 ms. However this barely brings the RTT measurements within the acceptable range. This is perhaps because of the poor ratio of users to available capacity. It should be noted that with the implementation of the ICT Vision 2010 plan particularly the setup of an Internet Exchange Router in 2005, we observe step improvements (for all parameters) in 2005 and 2006 i.e. in minimum RTTs, packet losses and throughputs.
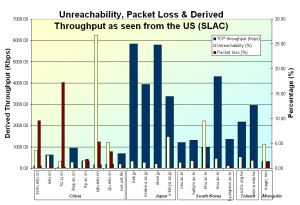
The graph - packet loss - summarizes the losses as seen from SLAC. These observations are independent of the distance between the sites (hence independent of RTTs). Here Taiwan, S. Korea and Japan show good results with losses of less than 1.0%. Mongolia and China both have improved significantly over the years and since 2005 have been within the acceptable range of less than 2.5%.
The throughput observed by the monitoring node in SLAC is as expected. Japan and Korea appear to be steadily improving (considering the increase in international bandwidth as discussed earlier), though with different rates. Taiwan on the other hand has overtook Japan, which is understandable when we consider the ratio of the annual rate of increase in bandwidth resources (i.e. 34%, discussed above) as compared to annual rate of increase in internet users (i.e. 2%).
...
...
...
RTT and Jitter
(as seen from SLAC)
were observed for South Korea after 2003. Since then S. Korea and Japan both have maintained their RTT measurements below 150 ms .
Measurements for China and Taiwan however show results in the years 1999 and 2000 (and 2001 for Taiwan) which do not agree with the constraints of nature. For these years the results (figure - Minimum RTT) show measurements of less than 100 ms which is not possible considering the speed of light in fibre and the distance between the observing (USA) and observed (China & Taiwan) nodes. We believe that the reason for this is that the observed nodes did not exist where they were expected to be. The nodes accessed for China and Taiwan were probably proxy nodes deployed somewhere in the US. Thus disregarding the years 1999-2001, the measurements for China are observed to be within the acceptable range (i.e. of less than 250 ms). These measurements however seem to increase slightly at a negligible rate of 0.007%. This may be attributed to the difference in rate of increase for the annual user growth i.e. 53.3% as compared to the increase in bandwidth resources i.e. 43.7%. Similarly for Taiwan, disregarding the measurements taken in 1999-2001, the results are found to be in the acceptable range and are maintaining themselves.
As a consequence of consistent government policies since 1994 and support from Asian Development Bank results for Mongolia have improved significantly i.e. from greater than 550 ms to less than 250 ms. However this barely brings the RTT measurements within the acceptable range. This is perhaps because of the poor ratio of users to available capacity. It should be noted that with the implementation of the ICT Vision 2010 plan particularly the setup of an Internet Exchange Router in 2005, we observe step improvements (for all parameters) in 2005 and 2006 i.e. in minimum RTTs, packet losses and throughputs.
The graph - packet loss - summarizes the losses as seen from SLAC. These observations are independent of the distance between the sites (hence independent of RTTs). Here Taiwan, S. Korea and Japan show good results with losses of less than 1.0%. Mongolia and China both have improved significantly over the years and since 2005 have been within the acceptable range of less than 2.5%.
The throughput observed by the monitoring node in SLAC is as expected. Japan and Korea appear to be steadily improving (considering the increase in international bandwidth as discussed earlier), though with different rates. Taiwan on the other hand has overtook Japan, which is understandable when we consider the ratio of the annual rate of increase in bandwidth resources (i.e. 34%, discussed above) as compared to annual rate of increase in internet users (i.e. 2%).
| |
RTT and Jitter | Unreachability, Loss and Throughput |
|---|
The summarized results shown in the graphs above feature interesting conclusions. We observed that average RTT values for different sites in China vary significantly, however the minimum RTT values tend to agree with those of their peers which is understandable. Also, the difference between the minimum RTT and average RTT is significantly large for most of the sites. Additionally there are large variations in the jitter values for these sites. These observations allow us to conclude that there is considerable amount of congestion within China. Also there are huge packet losses (5% - 17%) for few sites as shown in the figure above - Unreachability, Loss and Throughput - where as the rest show nearly acceptable results of less than 2.5% losses and similar (derived TCP) throughput values of approximately 900 Kbps. It is important to note that the sites with large variations in jitter and large difference between avg. RTT and min. RTT also show significantly less throughput, and more packet losses as compared to their peers.
...
Below are the aggregated performance results for the individual sites as seen from SLAC for the year 2007.
...