...
The international bandwidths for China, Japan, North Korea, South Korea, Mongolia and Taiwan are shown in the figure - International bandwidth - below. The statistics have been collected from Mike Jenson 10/18/07 - International bandwidth by country, Internet World Stats and ITU. They clearly show two groups of countries; those which have reasonable available resources (such as Japan ~100 Gbps aggregate, South Korea ~ 50 Gbps, Taiwan and China ~100 Gbps aggregate) and those which are lagging far behind (such as Mongolia).
...
The central projection of the Global Internet Map 2006 shows the international internet bandwidth and is scaled by capacity. The map also shows color-coded tags, indicating the number of internet hosts per 10,000 people. Each country is color-coded according to the extent of international internet bandwidth available. The maps of central projection and international bandwidth usage per country were prepared by TeleGeography.
PingER and Internet Performance
Pinger Coverage
| Include Page | ||||
|---|---|---|---|---|
|
The map - PingER coverage of Eastern Asia highlights the Monitoring (Red), Beacon (Blue) and Remote (green) sites in the region. The distribution of these nodes is shown in Table - 1 3 below.
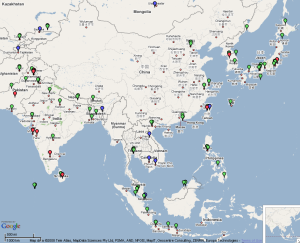
Table - 2 3 - Node Distribution in Eastern Asia
| Monitoring | Beacon | Remote |
|---|---|---|---|
Japan | 1 | 1 | 9 |
China | 2 | 1 | 7 (east) |
South Korea | 1 | 1 | 4 |
Mongolia | 0 | 1 | 0 |
Taiwan | 1 | 1 | 0 |
North Korea | 0 | 0 | 0 |
Worldwide Comparison
| Include Page | ||||
|---|---|---|---|---|
|
MOS for various Regions
| Include Page | ||||
|---|---|---|---|---|
|
Information on Calculation MOS can be found [here|http://www.slac.stanford.edu/comp/net/wan-mon/tutorial.html#mos].
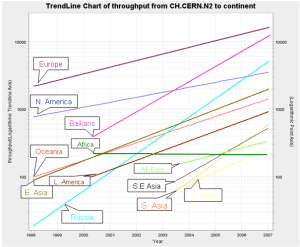
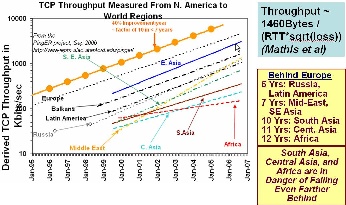
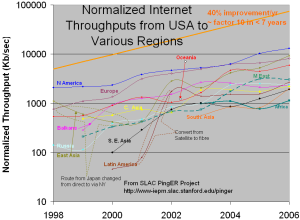
TCP throughput from CERN & SLAC to World Regions
| | |
Throughput trends as | TCP throughput as seen | Normalized Internet throughput |
|---|
...
It is important to look at the aggregated statistics mentioned above in the light of International bandwidth possessed by the East Asian countries as shown below.
Packet Loss, Minimum RTT and Throughput
| | |
Average RTT (as seen | Minimum RTT (as seen | Packet Loss (as seen |
|---|


| Wiki Markup |
|---|
Round Trip Times are measurements which are influenced by the distance between the sites. The minimum RTTs for Korea and Japan are within the acceptable range. Measurements for China and Taiwan are still within the acceptable range, however they appear to be moving towards the poor bracket i.e. of greater than 250 ms. \[<span style="color: #990033">This needs to be investigated</span>\] Results for Mongolia have improved significantly however they still lie in the range of poor. This is perhaps because of the poor ratio of users to available capacity. |
The graph on the right summarizes the packet losses as seen from SLAC. These observations are independent of the RTTs. Here Taiwan, S. Korea and Japan show good results with losses of less than 1.0%. Mongolia and China both have improved significantly over the years and since 2005 have been within the acceptable range of less than 2.5%.
|
Throughput (as seen |
|---|

| Wiki Markup |
|---|
\[<span style="color: #990033">This needs to be investigated</span>\] |
RoutingRouting
For the sake of reference, the figure below shows major international traffic routes with at least 9 Gbps of aggregate capacity and the submarine cable map. Domestic routes are omitted. The source is TeleGeography research.
...