...
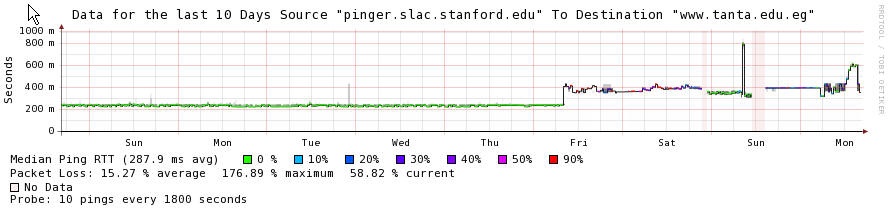
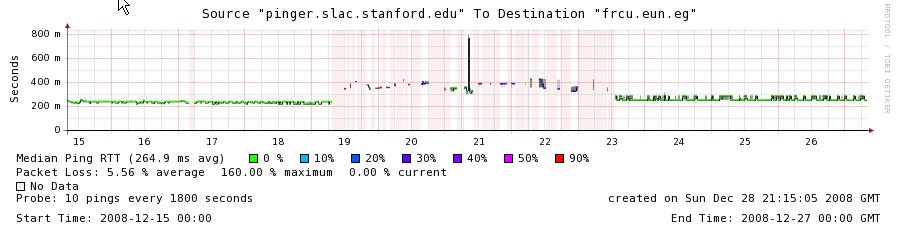
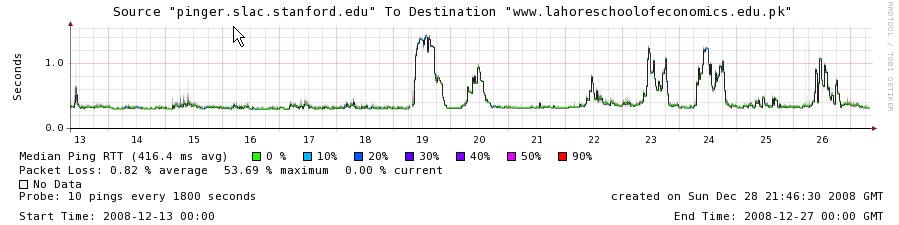
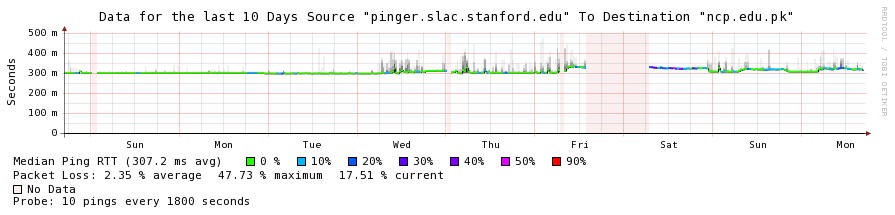
Examples of the increase in RTT can be seen below in the plot of RTT seen from SLAC to a host two hosts in Egypt, a host at the Lahore School of Economic, Pakistan and a host at the NCP provider in Pakistan. All show an increase in RTT around 9-10am on Friday Dec 19th 2009 (UDT). In the case of the www.tanta.edu.eg host in Egypt no loss of connectivity was observed at the time of the cut. However for the frcu.edun.eg besides the increase in RTT frequent losses of copnnectivity are observed and the link appears to be restored on January 23rd (www.frcu.edu.eg recovered at about the same time). In the case of Lahore there was a short period of no connectivity and over the days of the outage the RTT varied dramatically . In fact by Saturday for Lahore the losses dropped dropping back to a more normalnormal and full recovery did not appear to be complete by January 27th. NCP had a small increase in RTT and a long period of no connectivity later on Friday stretching into Saturday. These graphs illustrate the variability of the impact even within a country.

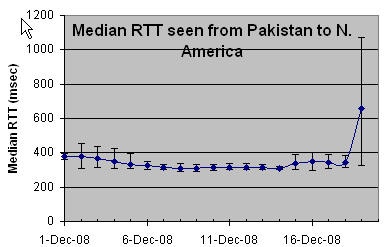
Another view of the effect of the RTT increases is seen in the plot below of the median RTTs measured (thed error bars are the 25% and 75%-tiles) from 3 monitoring hosts in Pakistan (NUST, COMSATS and NCP) to FNAL and SLAC (i.e. 6 pairs of monitor/remote hosts) for the first 19 days of December 2008.
...
The derived throughputs as a function of time for these countries for tghe above countries are shown below in a contour plot. The drastic reduction occuring December 19-20 2008 is quickly seen to the left. 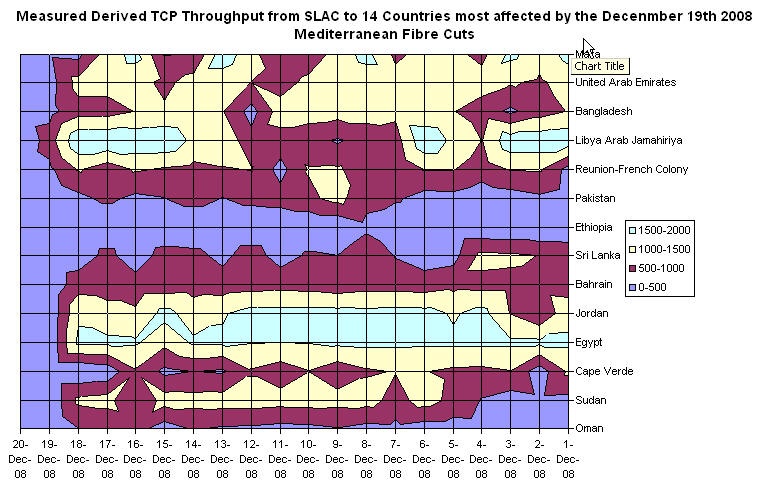
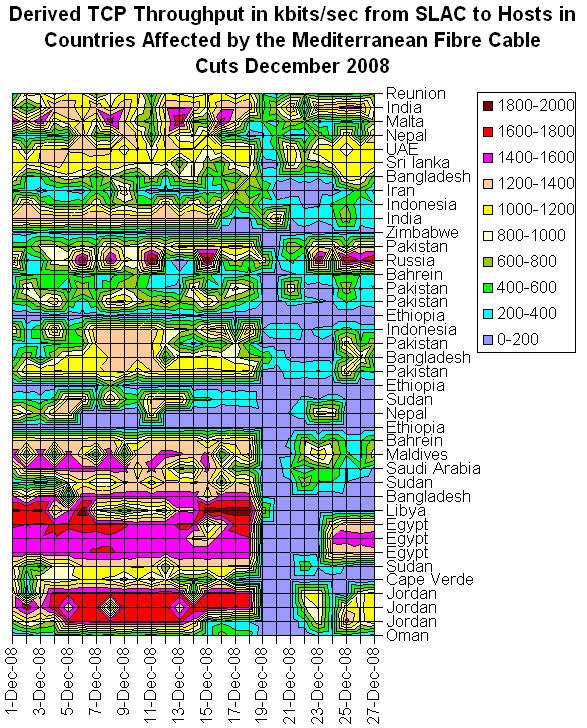
Another contour plot of the RBF but for a longedr period and using:
| Panel |
|---|
Residual_Bandwidth_Fraction = median(derived_throughput for Dec 19-27) / median(derived_throughput for Dec 1-18) |
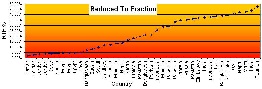
is shown in the table below together with the RBF per country. It is seen that hosts in some countries such as UAE and Egypt seem to have recovered by December 23rd, others such as Sudan, Cape Verde, Bangladesh (one of two hosts) and Libya are still badly affected. Others such as Saudi Arabia and Jordan are partially recovered. Also note the discrepancies in the recovery of the Pakistani hosts. Tthe grpah to trhe right shows the impact in terms of the Reduced Bandwidth Fraction for the various hosts. The inclusion of Russia is probably a statistical anomaly given the variability of the Dervided TCP throughputs (Inter Quartile Range ~ 990 kbits/sec) measured to the Russian host, the same can be said for Zimbabwe.
Contour plot of Derived TCP Throughput | Reduced Bandwidth Fraction |
|---|---|
| |
More Information
- Information on Submarine Communications
- 2008 Submarine Cable Disruption from Wikipedia.
From Harvey Newman, Caltech:
Interestingly, however, the current (Nov. 2008) issue of the newsletter, in addition to an article on the use of subsea cables for monitoring compliance to the International Nuclear Test Ban Treaty, features a story on Navy Undersea Cable Systems on Page 34. The entire issue can be found here:http://www.subtelforum.com/issues/WFN_41.pdf.Also give a look at the cable ship sighting section on Page 54 where you'll find A Global Guide to the Latest Known Locations of the World's Cable Ships as of May 2008, as provided by Lloyds List.And for those interested in how subsea cables are upgraded to higher throughput rates, see Same Pipes, Faster Speed, by Andy Lumsden on p. 38.