...
An example of the increase in RTT can be seen below in the plot of RTT seen from SLAC to a node in Egypt. The sudden change in RTT from ~ 244ms to almost 400ms can be seen around 9-10am on Friday Dec 19th 2009 (UDT). 
Another view of the effect of the RTT increases is seen in the plot below of the median RTTs measured (thed error bars are the 25% and 75%-tiles) from 3 monitoring hosts in Pakistan (NUST, COMSATS and NCP) to FNAL and SLAC (i.e. 6 pairs of monitor/remote hosts) for the first 19 days of December 2008. 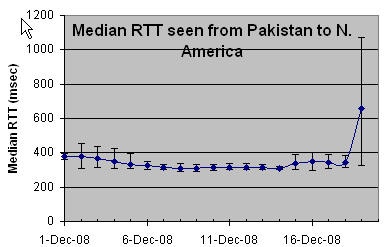
Minimum RTT
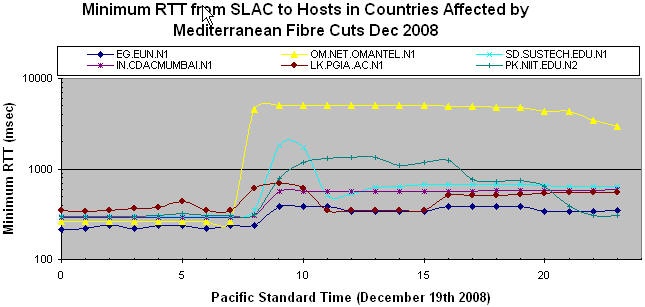
The minimum (of 10 pings) seen from SLAC to selected hosts in various affected countries is seen below. The Top Level Domain of each host appears at the start of the host name (EG = Egypt, IN = India, LK = Sri Lanka, OM = Oman, PK = Pakistan, SD = Sudan). Not all hosts in each country was similarly affected, due to the use of different carriers. The sudden changes in miniumum RTT are presumably due the choice of different routes to carry the traffic. It is seen that steps in minimum RTT occur after the initial cut as carriers changed the routing. Be aware that just because the minimum ERTT may return to its previous fibre cut values does not mean the performance has been restored, the route though being short may have insufficinent capacity and still be heavily congested.
Traceroutes from SLAC to Egypt
...