...
An example of the increase in RTT can be seen below in the plot of RTT seen from SLAC to a node in Egypt. The sudden change in RTT from ~ 244ms to almost 400ms can be seen around 9-10am. 
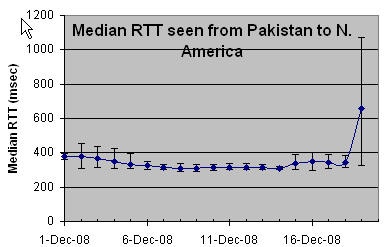
Another view of the effect of the RTT increases is seen in the plot below of the median RTTs measured (thed error bars are the 25% and 75%-tiles) from 3 monitoring hosts in Pakistan (NUST, COMSATS and NCP) to FNAL and SLAC (i.e. 6 pairs of monitor/remote hosts) for the first 19 days of December 2008.