Introduction
This Case Study of Latin American Internet performance was performed by Shahryar Khan and Les Cottrell of the SLAC IEPM-PingER group in anticipation of the ICFA Digital Divide Workshop: Mexico City October 24-27, 2007.
After indicating the deployment and coverage of the measurements made by PingER, it presents PingER measurements of round trip time (minimum and average), losses, jitter, and derived results such as throughput and Mean Opinion Score. The information is presented to show how Latin America looks as a region to and from the rest of the world and compares Latin America with other regions. Then it presents the status of the Research & Education network backbone in Latin America. Following this we show the historical performance of the Internet seen from SLAC for each individual country. This is followed with the current states of the various National Research and Education Networks (NRENs) for the various countries (this information is mainly from a presentation by Alberto Santoro at the April APS meeting 2007). We then look at the routing of Internet traffic within Latin America as seen from Brazil and Bolivia. Finally we compare the derived throughputs (a reasonable measure the quality of the network connection) with various Human and Economic indices.
PingER Coverage
The sites from which there is PingER monitoring are shown in red below, sites which are monitored by all monitoring hosts (these are referred to as beacon sites and also include monitor sites) are shown in blue, and other monitored remote sites are shown in green. From SLAC PingER monitors about 460 sites, CERN used to monitor about 132 sites, however after re-installing in December 2006) they now only monitor beacon sites (56). ICTP Trieste monitors 105 sites but only has data going back to September 2006. To the right of the PingER map we also show a map which defines how we are assigning countries to regions.
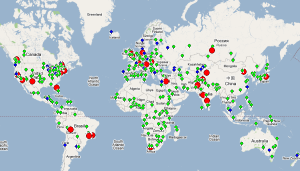
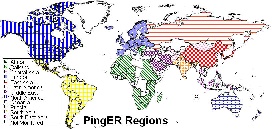
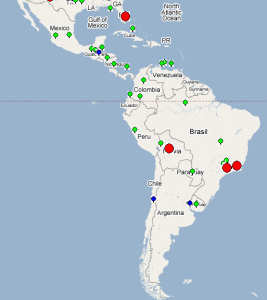
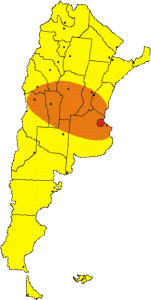
Latin America includes South America, Caribbean and Mexico. We have three monitoring hosts in Brazil (two in Sao Polo and one in Rio De Janeiro), one in Mexico (Cuidad Juarez) and one in Bolivia.The map below shows the location of the sites.
Latin America Compared to the rest of the World
Before we start to compare L. America to the rest of the world it is useful to look at a World Map of Internet Users. This shows that for most the developed world (US and Canada, W. Europe, Japan, Taiwan, S. Korea) typically 40% or more of the people have Internet connectivity while for Latin America and the Caribbean that contains about 8% of the world's population, the penetration is about 17%, i.e. typically a factor of 2-3 less.
Minimum RTT and Packet Loss from US to Latin American Countries
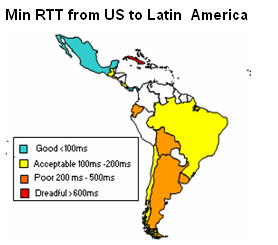
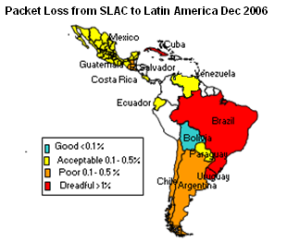
The above figure shows the Min RTT and packet loss to Latin American countries from SLAC. Mexico seems to have the least RTT and acceptable loss due to its direct connectivity with the US. Argentina, Brazil and Chile are also performing reasonably well. Bolivia, Ecuador and Paraguay are catching up. However Cuba is still stuck to satellite and the performance is dreadful.
From SLAC: 1. Packet Loss, 2. Min RTT to World Regions, 3. Unreachability, 4. Jitter
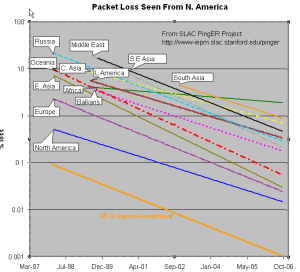
The left hand figure shows the packet loss to various regions of the world as seen from N. America. Since losses are fairly distance independent no attempt has been made to normalize the data. For typical bursty Internet loss patterns, losses of >1% will result in annoying interactive VoIP and video conferencing. It is seen that the world divides up into two major super-regions: N. America, Europe, E. Asia and Oceania with losses below 0.1%, and Latin America, C. Asia, Russia, S.E. Asia, S. Asia and Africa with losses > 0.1% and as high as as a few per-cent. All countries are improving exponentially, but Africa is falling further behind most regions.
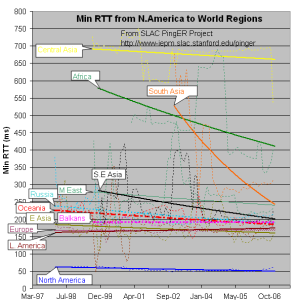
The left middle figure shows the drop in the MinimumRTTs of > 400ms result in poor real-time interactivity. The large step for S. Asia in 2003 was due to the change over from satellite to fibre. Central Asia (also Afghanistan) has hardly moved in its minimum RTT since it continues to use geostationary satellites.
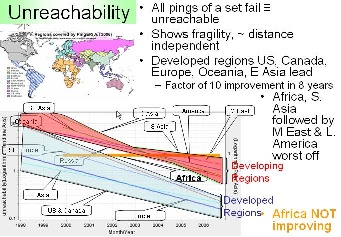
The right middle graph shows the unreachability of world regions seen from the US. A host is deemed unreachable if all pings of a set fail to respond. It shows the fragility of the links and is mainly distance independent (the reasons for fragility are usually in the last mile, the end site or host). Again the developed regions US and Canada, E. Asia, and Oceania have the lowest unreachability (< 0.3%) while the other regions have unreachability from 0.7% to 2%, and again Africa is not improving, with Latin America having the fourth worst unreachability (after Africa, S. Asia and the Middle East).
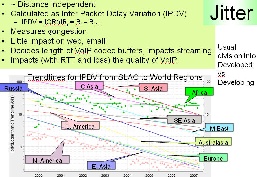
The right hand graph shows the jitter or variability of world regions seen from the US. The jitter is defined as the Inter Quartile Range (IQR) of the Inter Packet Delay Variability (IPDV i = RTT i - RTT i-1) . The Jitter is relatively distance independent, it measures congestion, and has little impact on the Web and email. It decides the length of VoIP codec buffers and impacts streaming. For real-time multimedia (H.323) Performance Measurement and Analysis of H.323 Traffic gives for one way: jitter = 0-20ms = Good, jitter = 20-50ms = acceptable, > 50ms = poor. We measure round-trip jitter which is roughly two times the one way jitter. We see the usual division into developed versus developing regions.
MOS for various regions
| Include Page | ||||
|---|---|---|---|---|
|
TCP throughput from CERN & SLAC to World Regions
| Include Page | ||||
|---|---|---|---|---|
|
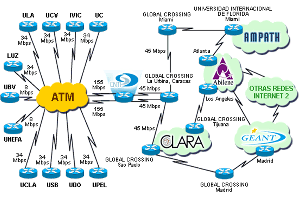
ALICE and RedCLARA
Since its launch in September 2004, the ALICE projecthas been a key component in reducing disparities within Latin America by bridging the "Digital Divide" both within the region and with the rest of the world. The project has enabeled Latin American researchers to become key players in the global research community.

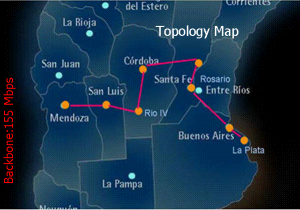
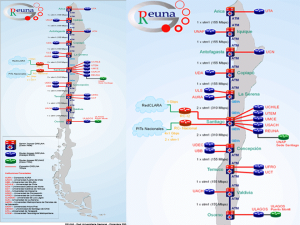
On September 1 of 2004, RedCLARAbegan to provide direct connectivity with 155 Mbps, in "a ring" topology, linking the NRENs of Argentina, Brazil, Chile, Panama and Mexico, and connecting them to GÉANT at 622 Mbps throughout a connection between São Paulo, Brazil, and Madrid, Spain.RedCLARA now connects 14 countries across Central and South America, allowing 738 universities and research institutes to communicate with their European and global peers directly.
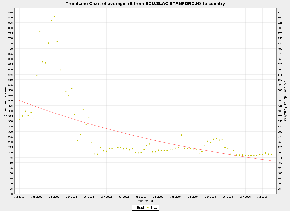
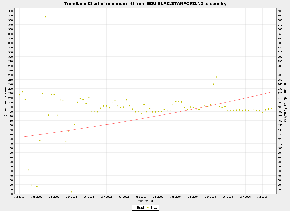
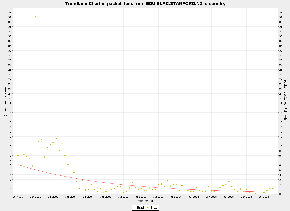
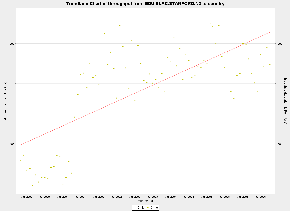
The performance of Research and Educational Networks of Argentina, Brazil, Chile, Mexico, Guatemala and Uruguay has significantly improved due to ALICE project. In December 2001, Argentina's (RETINA) connected to AMPATH, so the increase in performance to Argentina can be seen from US. Around June 2006 the TCP throughput of Argentina increased significantly. The average RTT reduced from 600 ms to 200 ms. The minimum RTT reduced from 250 ms to 200 ms. The packet loss has also decreased significantly. From January 2001 - July 2001 the loss from US to Brazil decreased from 8 % to 1 %. The Average RTT decreased from 375 ms to 200 ms. The TCP throughput improved but it has not stabilized (still lots of variations). In June 2001, Chile's REUNA becomes the first Latin American NREN (National Research and Educational Network) to get connected to the AMPATH POP in Miami. As a result the TCP throughput increased significantly. Minimum RTT reduced from 230 ms to 200 ms and average RTT reduced from 725 ms to 250ms. Packet loss reduced from 10 % to 1 %. In July 2003 Mexico's connectivity improved. Minimum RTT became stable from 100 ms to 60 ms and average RTT also became stable. Since Uruguay joined in June, 2005 its TCP throughput has improved. Average RTT reduced from about 325 ms to 225 ms. Minimum RTT reduced from about 270 ms to 220 ms The loss situation has not seen much improvement.
In the beginning of 2006 Paraguay moved from satellite to fiber but Cuba is still connected through satellite. Average and min RTT of Cuba are greater than 800ms and the packet loss is around 2-4 % which is dreadful. RedClara is also planning for a connection to Cuba in the near future, so that it can also play role in global research initiatives.
Status of Latin American Countries
A very interesting presentation of the status of networking in Latin America can be found in "Closing the Digital Divide in Latin America" by Alberto Santoro or UERJ, Brazil. Below we show the measured performance of connections from N. America to Latin America.
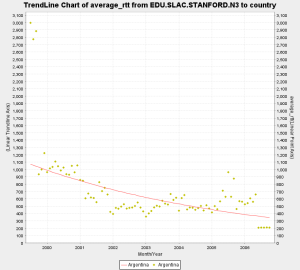
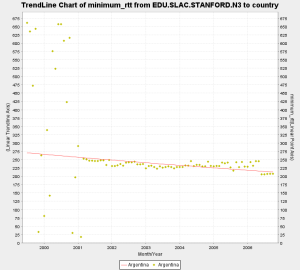
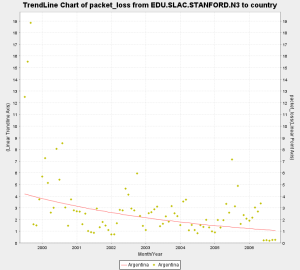
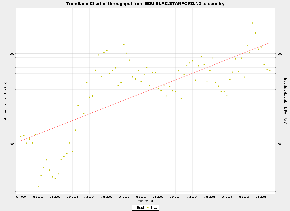
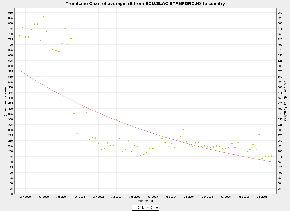
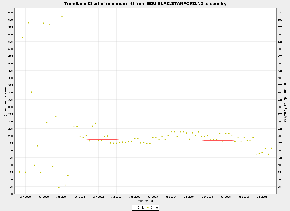
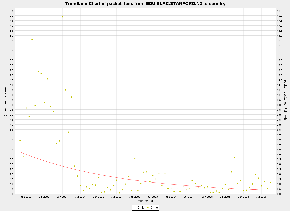
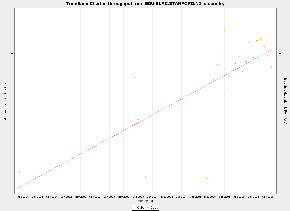
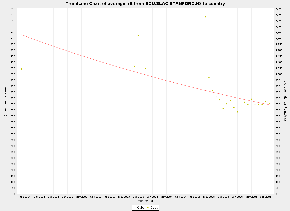
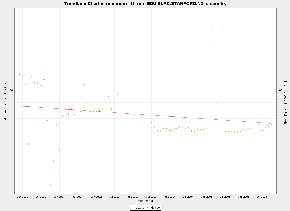
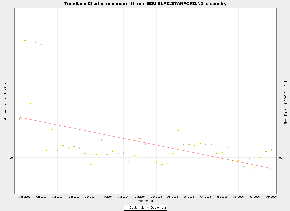
Argentina
In December 2001, Argentina's (RETINA) connected to AMPATH, so the increase in performance to Argentina can be seen from SLAC. Around June 2006 the TCP throughput of Argentina increased significantly. The average RTT reduced from 600 ms to 200 ms. The minimum RTT reduced from 250 ms to 200 ms.The packet loss has also decreased significently.
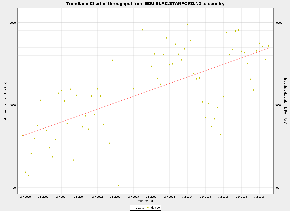
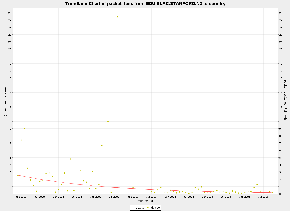
Brazil
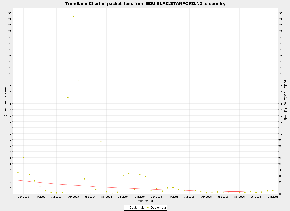
Around Janruary 2001 - July 2001 the loss decreased from 8 % to 1 %. The Average RTT decreased from 375 ms to 200 ms
The TCP throughput improved but it hasn't stabilized (still lots of variation)
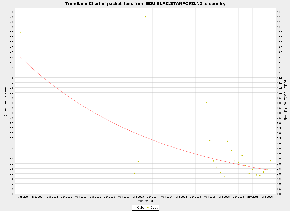
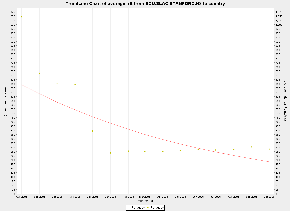
Chile
In June 2001, Chile's REUNA becomes the first LA NREN(National Research and Educational Network) to get connected to the Ampath POP in Miami. As a result the TCP throughput increased significantly. The minimun RTT reduced from 230 ms to 200 ms and Average RTT reduced from 725 ms to 250 ms Packet loss reduced from 10 % to 1 %.
Cuba
Poor performance due to satellite link. Average and min RTT are about 800ms. Packet loss is around 2-4 % in 2006
(The only hope for Cuba is to connect to RedClara) RedClara plans to connect to Cuba in the near future

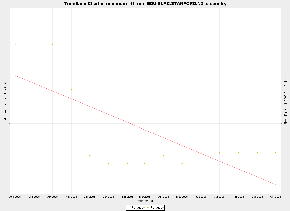
Mexico
July 2003 performance improved . Minumum RTT became stable 100 ms to 60 ms and Average RTT also became stable.
but January 2005 to July 2005 again problem arose
Guatemala
Janruary 2005 packet loss becomes stabilizing >1% April 2003 minimum and average RTT improved
Paraguay
Shift from satellite to fibre at the start 2006.
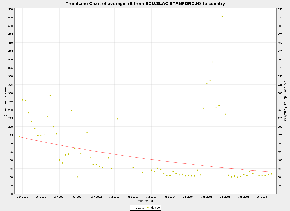
Uruguay
Since Uruguay joined in June, 2005 its TCP throughput has improved. Average RTT reduced from about 325 ms to 225 ms
Minimum RTT reduced from about 270 ms to 220 ms The loss situation hasn't seen much improvement
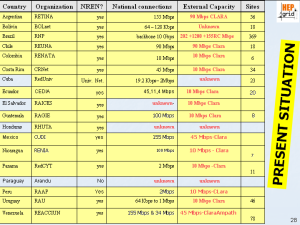
Present Situation of NRENs
Argentina
Connected to RedCLARA (90 Mpbs) 42 universities, 8 National Research Laboratories, 5 Government Agencies
Good Poor Very Poor
Bolivia
Not connected to RedCLARA, no topology map available.
Chile
Brazil
Costa Rica
One ministry, 2 non governmental institutions, 3 Universities , 3 Scientific-technological Institutes or Academies
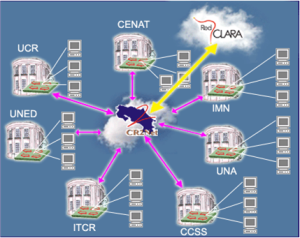
45 Mbps 10 Mbps
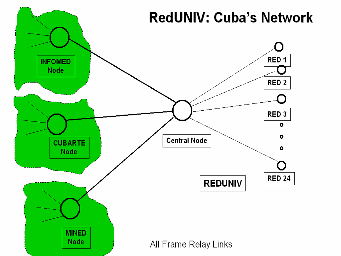
Cuba
22 Universities and Research centers
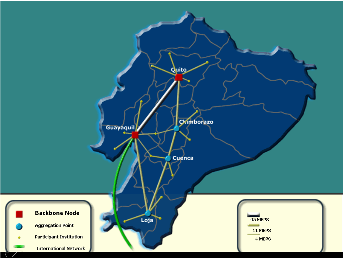
Ecuador
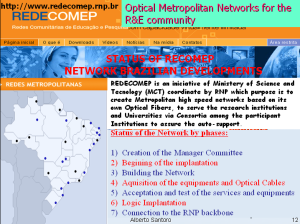
20 Universities , schools and Research and Development Institutions
El Salvador
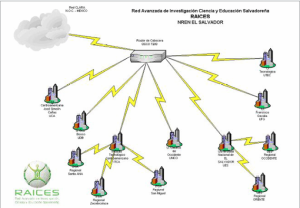
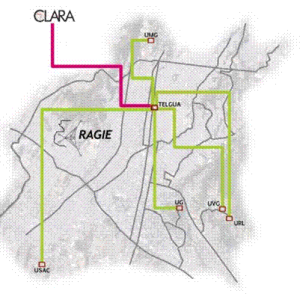
Guatemala
6 Universities, 2 non governmental institutions ans 1 research center (backbone) 100 Mbps
Honduras
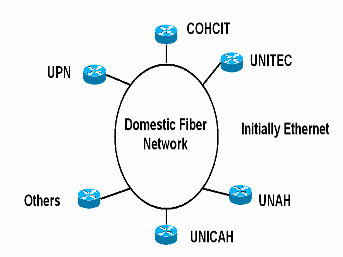
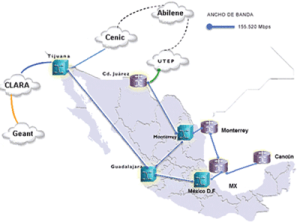
Mexico
4 4 Non Government Institutions, 19 Research centers, 33 Universities, 11 Institutes, 1 Faculty Independent , 7 Superior Schools 1 government institution.
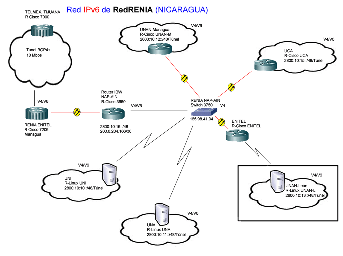
Nicaragua
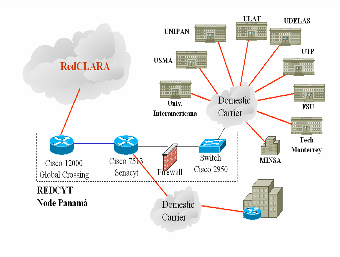
Panama
7 Universities and 3 Governmental Institutions
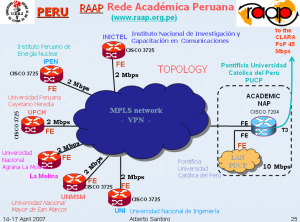
Peru
Uruguay
31 Universities Institutions ans Schools
Venezuela
Routing
Traceroute from SLAC to Latin American Countries

Routes from Brazil to other Latin American Countries
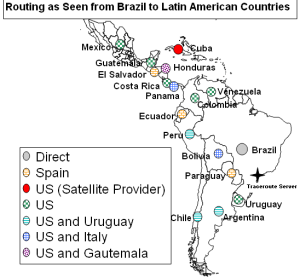
Looking at the traceroutes from Brazilian sites to other Latin American countries, it can be seen that links with other Brazilian sites are direct while to other Latin American countries they go via the US and or Europe.
Brazil to Brazil: Direct
Brazil to Ecuador: Brazil -> Spain(Madrid) -> Ecuador OR Brazil -> US (Kansas) -> Ecuador
Brazil to Cuba: Brazil -> US(Miami) -> (Satellite Provider) -> Cuba
Brazil to Venezuela: Brazil -> Europe -> Venezuela OR Brazil -> US -> Venezuela OR Brazil -> Spain(Madrid)-> Venezuela
Brazil to Costa Rica: Brazil -> US -> Costa Rica
Brazil to Argentina: Brazil -> US -> Uruguay -> Argentina
Brazil to Mexico: Brazil -> US(California) -> Mexico
Brazil to Chile: Brazil -> US -> Uruguay -> Chile
Brazil to Uruguay: Brazil -> US (California) -> Uruguay
Brazil to Bolivia: Brazil -> US (Kansas) -> Italy (Rome) -> Bolivia
Brazil to Paraguay: Brazil -> Spain (Madrid) -> Paraguay
Brazil to Honduras: Brazil -> US(Kansas) -> Guatemala -> Honduras
Brazil to Peru: Brazil -> US(California) -> Uruguay -> Peru
Brazil to Colombia: Brazil -> US (Kansas) -> Colombia
Brazil to Guatemala: Brazil -> US -> Gutemala
Brazil to El Salvador: Brazil -> Spain (Madrid) -> El Salvador
Brazil to Panama: Brazil -> US -> Italy(Rome) -> Panama!tracerouter_Brazil_.png|thumbnail!
Routes from Bolivia to other Latin American Countries
Looking at traceroutes from Bolivia to other Latin American countries, the routes to Bolivian sites are direct, while to other Latin American countries they go via the U.S. and/or Europe.
Bolivia to Brazil: Bolivia -> US -> Brazil
Bolivia to El Salvador: Bolivia -> Italy -> US(Miami) -> El Salvador
Bolivia to Venezuela: Bolivia -> Italy -> Venezuela
Bolivia to Mexico: Bolivia -> US(Kansas) -> Mexico
Bolivia to Argentina: Bolivia -> Italy -> US -> Argentina
Bolivia to Guatemala: Bolivia -> US -> Guatemala
Bolivia to Colombia: Bolivia -> US(Kansas) -> Colombia
PingER Coverage
The sites from which there is PingER monitoring are shown in red below, sites which are monitored by all monitoring hosts (these are referred to as beacon sites and also include monitor sites) are shown in blue, and other monitored remote sites are shown in green. From SLAC PingER monitors about 460 sites, CERN used to monitor about 132 sites, however after re-installing in December 2006) they now only monitor beacon sites (56). ICTP Trieste monitors 105 sites but only has data going back to September 2006. To the right of the PingER map we also show a map which defines how we are assigning countries to regions.
Latin America includes South America, Caribbean and Mexico. We have three monitoring hosts in Brazil (two in Sao Polo and one in Rio De Janeiro), one in Mexico (Cuidad Juarez) and one in Bolivia.The map below shows the location of the sites.
Latin America Compared to the rest of the World
Before we start to compare L. America to the rest of the world it is useful to look at a World Map of Internet Users. This shows that for most the developed world (US and Canada, W. Europe, Japan, Taiwan, S. Korea) typically 40% or more of the people have Internet connectivity while for Latin America and the Caribbean that contains about 8% of the world's population, the penetration is about 17%, i.e. typically a factor of 2-3 less.
From SLAC: 1. Packet Loss, 2. Min RTT to World Regions, 3. Unreachability, 4. Jitter
The left hand figure shows the packet loss to various regions of the world as seen from N. America. Since losses are fairly distance independent no attempt has been made to normalize the data. For typical bursty Internet loss patterns, losses of >1% will result in annoying interactive VoIP and video conferencing. It is seen that the world divides up into two major super-regions: N. America, Europe, E. Asia and Oceania with losses below 0.1%, and Latin America, C. Asia, Russia, S.E. Asia, S. Asia and Africa with losses > 0.1% and as high as as a few per-cent. All countries are improving exponentially, but Africa is falling further behind most regions.
The left middle figure shows the drop in the MinimumRTTs of > 400ms result in poor real-time interactivity. The large step for S. Asia in 2003 was due to the change over from satellite to fibre. Central Asia (also Afghanistan) has hardly moved in its minimum RTT since it continues to use geostationary satellites.
The right middle graph shows the unreachability of world regions seen from the US. A host is deemed unreachable if all pings of a set fail to respond. It shows the fragility of the links and is mainly distance independent (the reasons for fragility are usually in the last mile, the end site or host). Again the developed regions US and Canada, E. Asia, and Oceania have the lowest unreachability (< 0.3%) while the other regions have unreachability from 0.7% to 2%, and again Africa is not improving, with Latin America having the fourth worst unreachability (after Africa, S. Asia and the Middle East).
The right hand graph shows the jitter or variability of world regions seen from the US. The jitter is defined as the Inter Quartile Range (IQR) of the Inter Packet Delay Variability (IPDV i = RTT i - RTT i-1) . The Jitter is relatively distance independent, it measures congestion, and has little impact on the Web and email. It decides the length of VoIP codec buffers and impacts streaming. For real-time multimedia (H.323) Performance Measurement and Analysis of H.323 Traffic gives for one way: jitter = 0-20ms = Good, jitter = 20-50ms = acceptable, > 50ms = poor. We measure round-trip jitter which is roughly two times the one way jitter. We see the usual division into developed versus developing regions.
MOS for various regions
...
TCP throughput from CERN & SLAC to World Regions
...
Status of Latin American Countries
A very interesting presentation of the status of networking in Latin America can be found in "Closing the Digital Divide in Latin America" by Alberto Santoro or UERJ, Brazil. Below we show the measured performance of connections from N. America to Latin America.
Argentina
In December 2001, Argentina's (RETINA) connected to AMPATH, so the increase in performance to Argentina can be seen from SLAC. Around June 2006 the TCP throughput of Argentina increased significantly. The average RTT reduced from 600 ms to 200 ms. The minimum RTT reduced from 250 ms to 200 ms.The packet loss has also decreased significently.
Brazil
Around Janruary 2001 - July 2001 the loss decreased from 8 % to 1 %. The Average RTT decreased from 375 ms to 200 ms
The TCP throughput improved but it hasn't stabilized (still lots of variation)
Chile
In June 2001, Chile's REUNA becomes the first LA NREN(National Research and Educational Network) to get connected to the Ampath POP in Miami. As a result the TCP throughput increased significantly. The minimun RTT reduced from 230 ms to 200 ms and Average RTT reduced from 725 ms to 250 ms Packet loss reduced from 10 % to 1 %.
Cuba
Poor performance due to satellite link. Average and min RTT are about 800ms. Packet loss is around 2-4 % in 2006
(The only hope for Cuba is to connect to RedClara) RedClara plans to connect to Cuba in the near future
Mexico
July 2003 performance improved . Minumum RTT became stable 100 ms to 60 ms and Average RTT also became stable.
but January 2005 to July 2005 again problem arose
Guatemala
Janruary 2005 packet loss becomes stabilizing >1% April 2003 minimum and average RTT improved
Uruguay
Since Uruguay joined in June, 2005 its TCP throughput has improved. Average RTT reduced from about 325 ms to 225 ms
Minimum RTT reduced from about 270 ms to 220 ms The loss situation hasn't seen much improvement
Paraguay
Shift from satellite to fibre at the start 2006.
Present Situation of NRENs
Argentina
Connected to RedCLARA (90 Mpbs) 42 universities, 8 National Research Laboratories, 5 Government Agencies
Good Poor Very Poor
Bolivia
Not connected to RedCLARA, no topology map available.
Chile
Brazil
Costa Rica
One ministry, 2 non governmental institutions, 3 Universities , 3 Scientific-technological Institutes or Academies
45 Mbps 10 Mbps
Cuba
22 Universities and Research centers
Ecuador
20 Universities , schools and Research and Development Institutions
El Salvador
Guatemala
6 Universities, 2 non governmental institutions ans 1 research center (backbone) 100 Mbps
Honduras
Mexico
4 4 Non Government Institutions, 19 Research centers, 33 Universities, 11 Institutes, 1 Faculty Independent , 7 Superior Schools 1 government institution.
Nicaragua
Panama
7 Universities and 3 Governmental Institutions
Peru
Uruguay
31 Universities Institutions ans Schools
Venezuela
Traceroute from SLAC to Latin American Countries
Routes from Brazil to other Latin American Countries
Looking at the traceroutes from Brazilian sites to other Latin American countries, it can be seen that links with other Brazilian sites are direct while to other Latin American countries they go via the US and or Europe.
Brazil to Brazil: Direct
Brazil to Ecuador: Brazil -> Spain(Madrid) -> Ecuador OR Brazil -> US (Kansas) -> Ecuador
Brazil to Cuba: Brazil -> US(Miami) -> (Satellite Provider) -> Cuba
Brazil to Venezuela: Brazil -> Europe -> Venezuela OR Brazil -> US -> Venezuela OR Brazil -> Spain(Madrid)-> Venezuela
Brazil to Costa Rica: Brazil -> US -> Costa Rica
Brazil to Argentina: Brazil -> US -> Uruguay -> Argentina
Brazil to Mexico: Brazil -> US(California) -> Mexico
Brazil to Chile: Brazil -> US -> Uruguay -> Chile
Brazil to Uruguay: Brazil -> US (California) -> Uruguay
Brazil to Bolivia: Brazil -> US (Kansas) -> Italy (Rome) -> Bolivia
Brazil to Paraguay: Brazil -> Spain (Madrid) -> Paraguay
Brazil to Honduras: Brazil -> US(Kansas) -> Guatemala -> Honduras
Brazil to Peru: Brazil -> US(California) -> Uruguay -> Peru
Brazil to Colombia: Brazil -> US (Kansas) -> Colombia
Brazil to Guatemala: Brazil -> US -> Gutemala
Brazil to El Salvador: Brazil -> Spain (Madrid) -> El Salvador
Brazil to Panama: Brazil -> US -> Italy(Rome) -> Panama!tracerouter_Brazil_.png|thumbnail!
Routes from Bolivia to other Latin American Countries
Looking at traceroutes from Bolivia to other Latin American countries, the routes to Bolivian sites are direct, while to other Latin American countries they go via the U.S. and/or Europe.
Bolivia to Brazil: Bolivia -> US -> Brazil
Bolivia to El Salvador: Bolivia -> Italy -> US(Miami) -> El Salvador
Bolivia to Venezuela: Bolivia -> Italy -> Venezuela
Bolivia to Mexico: Bolivia -> US(Kansas) -> Mexico
Bolivia to Argentina: Bolivia -> Italy -> US -> Argentina
Bolivia to Guatemala: Bolivia -> US -> Guatemala
Bolivia to Colombia: Bolivia -> US(Kansas) -> Colombia
ALICE and RedCLARA
Since its launch in September 2004, the ALICE project has been a key component in reducing disparities within Latin America by bridging the "Digital Divide" both within the region and with the rest of the world. The project has enabeled Latin American researchers to become key players in the global research community.
On September 1 of 2004, RedCLARA began to provide direct connectivity with 155 Mbps, in "a ring" topology, linking the NRENs of Argentina, Brazil, Chile, Panama and Mexico, and connecting them to GÉANT at 622 Mbps throughout a connection between São Paulo, Brazil, and Madrid, Spain.RedCLARA now connects 14 countries across Central and South America, allowing 738 universities and research institutes to communicate with their European and global peers directly.
The performance of Research and Educational Networks of Argentina, Brazil, Chile, Mexico, Guatemala and Uruguay has significantly improved due to ALICE project. In December 2001, Argentina's (RETINA) connected to AMPATH, so the increase in performance to Argentina can be seen from US. Around June 2006 the TCP throughput of Argentina increased significantly. The average RTT reduced from 600 ms to 200 ms. The minimum RTT reduced from 250 ms to 200 ms. The packet loss has also decreased significantly. From January 2001 - July 2001 the loss from US to Brazil decreased from 8 % to 1 %. The Average RTT decreased from 375 ms to 200 ms. The TCP throughput improved but it has not stabilized (still lots of variations). In June 2001, Chile's REUNA becomes the first Latin American NREN (National Research and Educational Network) to get connected to the AMPATH POP in Miami. As a result the TCP throughput increased significantly. Minimum RTT reduced from 230 ms to 200 ms and average RTT reduced from 725 ms to 250ms. Packet loss reduced from 10 % to 1 %. In July 2003 Mexico's connectivity improved. Minimum RTT became stable from 100 ms to 60 ms and average RTT also became stable. Since Uruguay joined in June, 2005 its TCP throughput has improved. Average RTT reduced from about 325 ms to 225 ms. Minimum RTT reduced from about 270 ms to 220 ms The loss situation has not seen much improvement.
In the beginning of 2006 Paraguay moved from satellite to fiber but Cuba is still connected through satellite. Average and min RTT of Cuba are greater than 800ms and the packet loss is around 2-4 % which is dreadful. RedClara is also planning for a connection to Cuba in the near future, so that it can also play role in global research initiatives.
Minimum RTT and Packet Loss from US to Latin American Countries
Figure shows the Min RTT and packet loss to Latin American countries from SLAC. Mexico seems to have the least RTT and acceptable loss due to its direct connectivity with the US. Argentina, Brazil and Chile are also performing reasonably well. Bolivia, Ecuador and Paraguay are catching up. However Cuba is still stuck to satellite and the performance is dreadful.
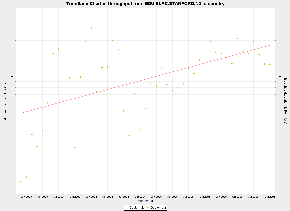
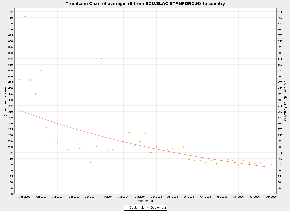
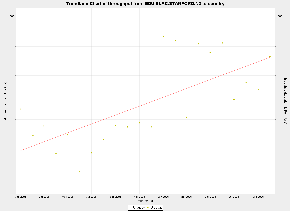
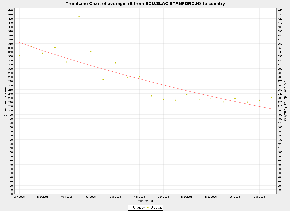
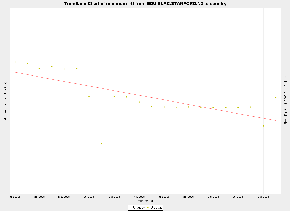
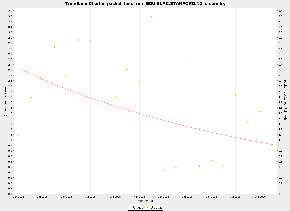
Comparisons with "Development" Indices
...