Page History
| Table of Contents |
|---|
Command to start
| Code Block |
|---|
ami-local -b 1 -f interval=1 psana://exp=tmoc00118,run=222,dir=/cds/data/psdm/prj/public01/xtc |
Finding control nodes for this example
Mask
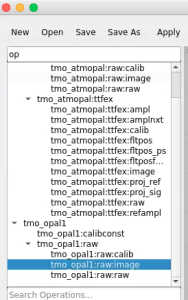
Mask (2D or 3D array) is created mainly from calibration constants of particular detector.
...
Adjust the mask parameters using editor window and click on "Apply" button again. Mask image will have changed according to set parameters.
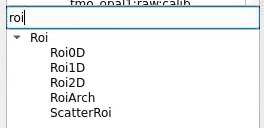
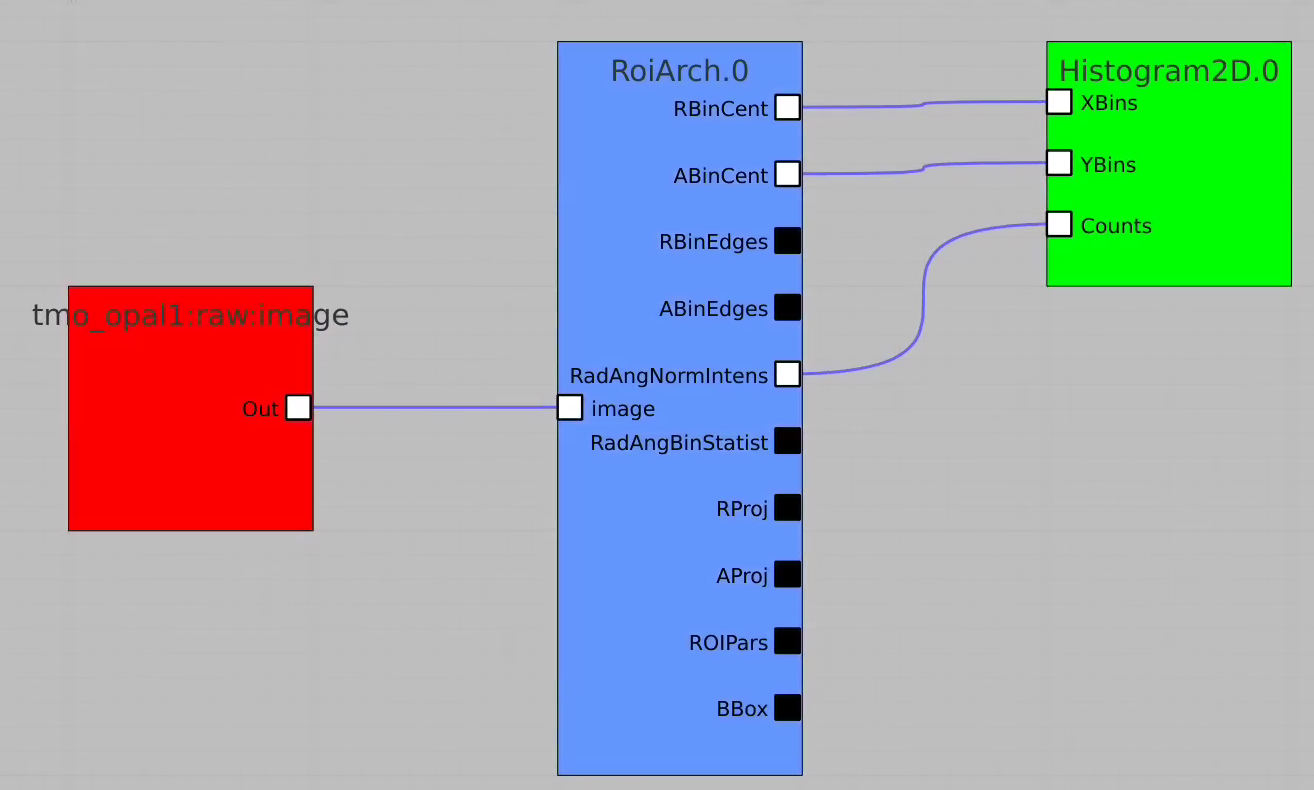
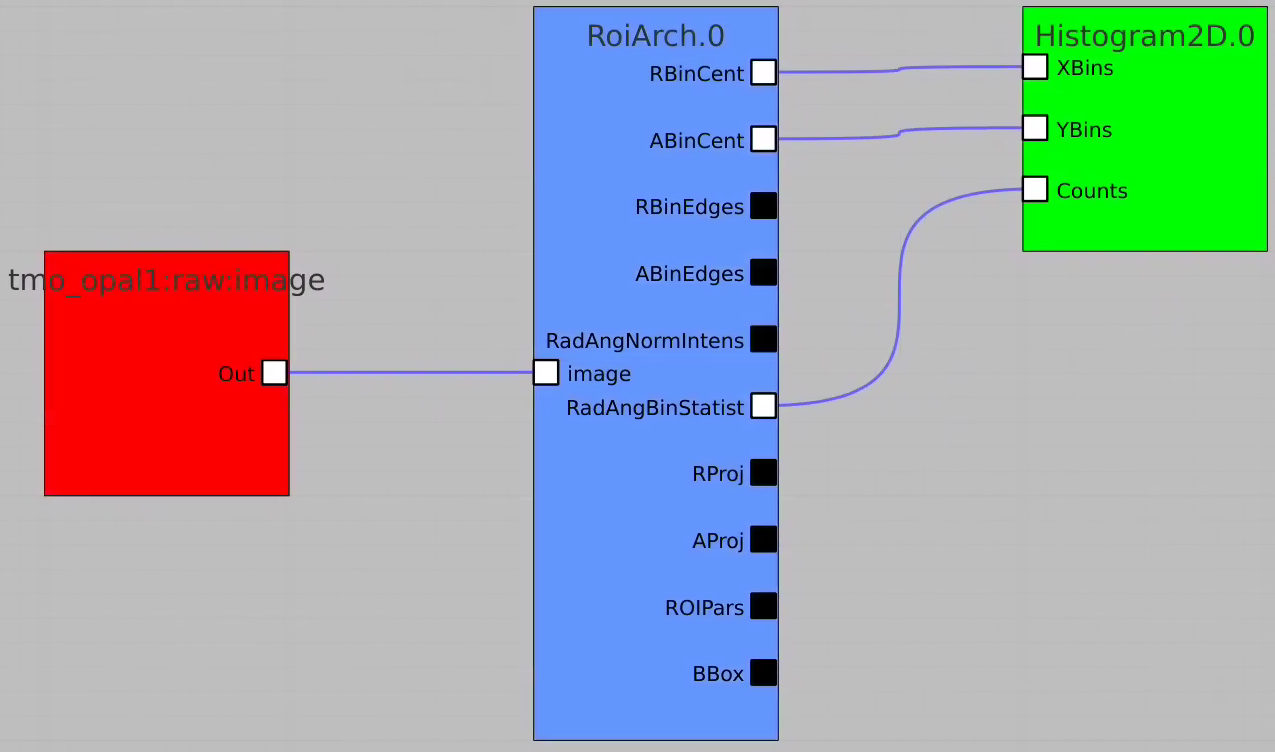
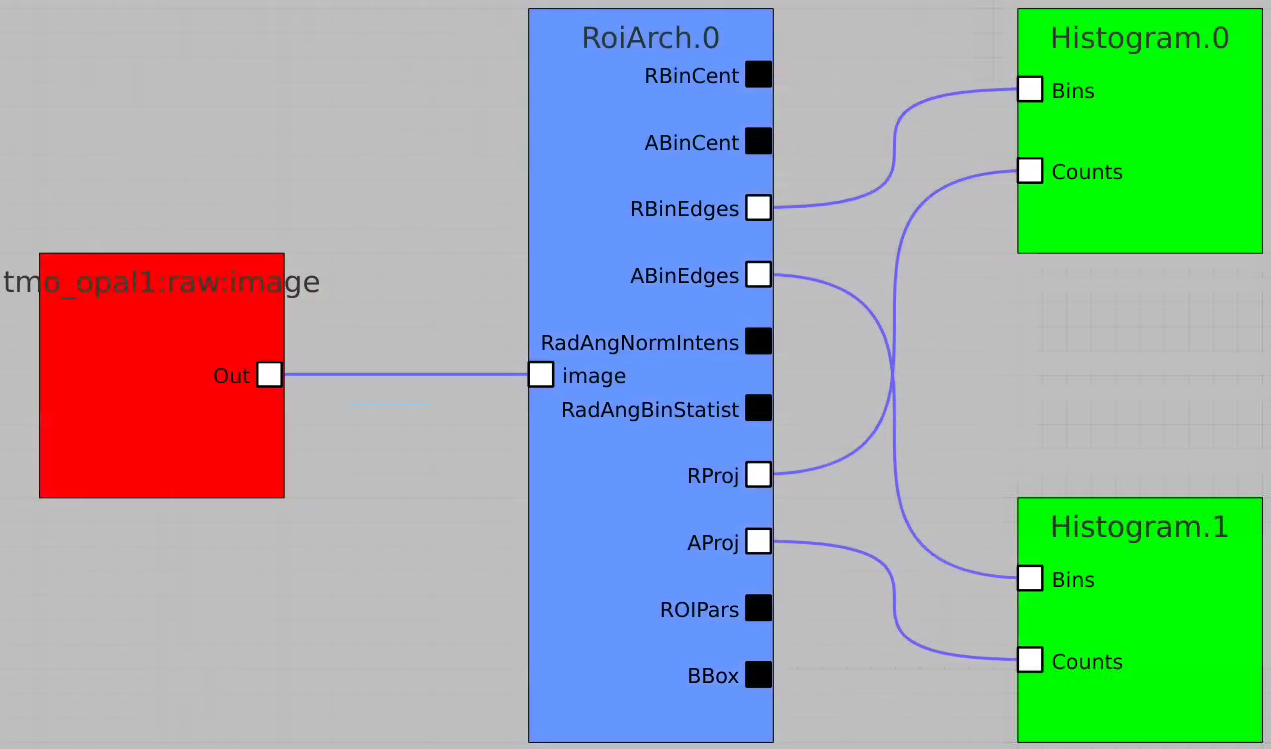
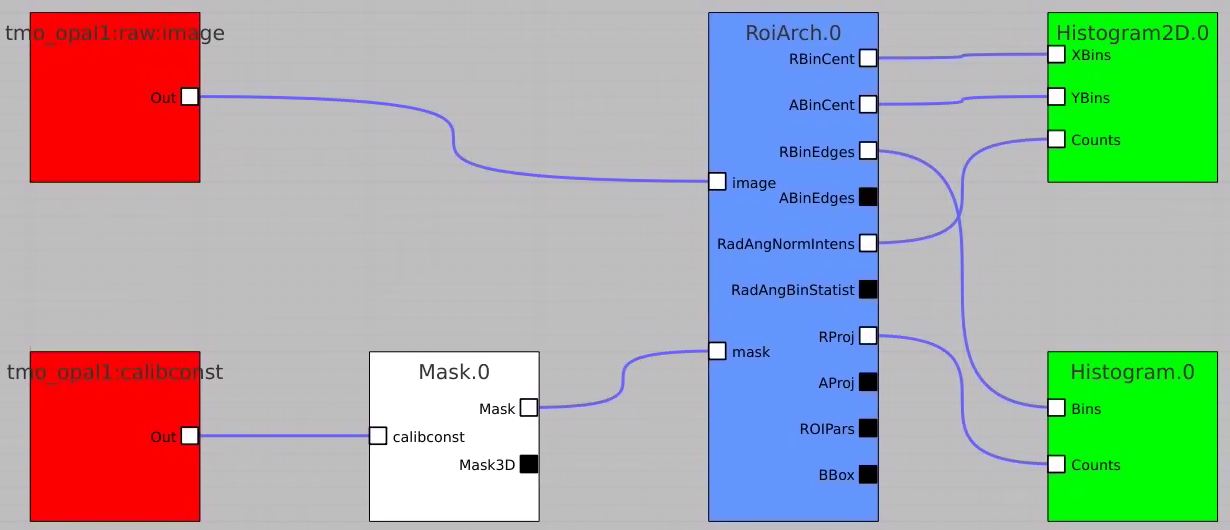
RoiArch
Simple example
In simple case we use 2D image as input array without mask and ImageViewer with bin numbers in stead of actual scales for radial and angular dimensions.
...
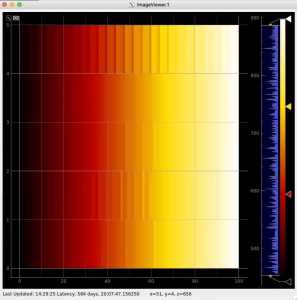
Then click on ImageViewer.0 and ImageViewer.1 control nodes to see images for r-angle per pixel normalized intensity and associated pixel per bin statistics.
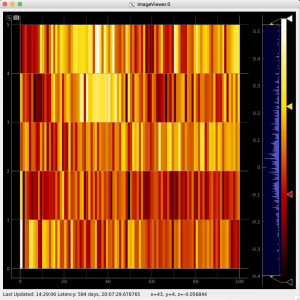
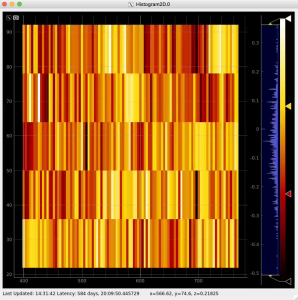
Plot radial-angular distribution with scales scale
R-angular plot with scales for normalized intensity
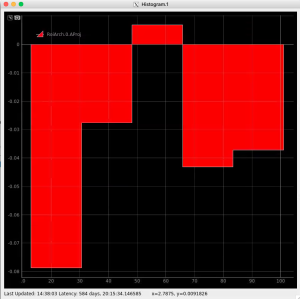
R-angular plot with scales for per-bin pixel statistics
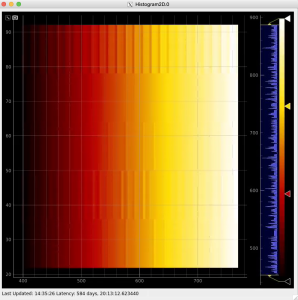
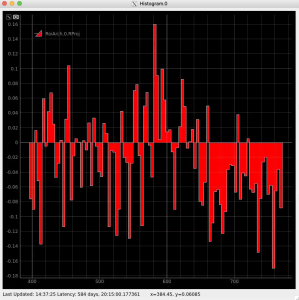
Radial and angular projections with normalized per pixel intensity
Arrays of N+1 bin edges should be used for 1D histograms
Apply mask
Bring RoiArch to the flowchart, connect th Mask.0 control node output (2D) Mask with RoiArch "mask" input terminal.
Then build other control nodes as in previous examples, click on "Apply" button, etc.
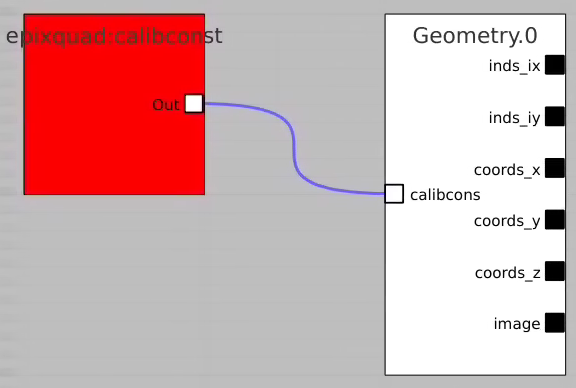
Geometry and Detector Image
Command to test
| Code Block | ||
|---|---|---|
| ||
ami-local -b 1 -f interval=1 psana://exp=uedcom103,run=7,dir=/cds/data/psdm/prj/public01/xtc |
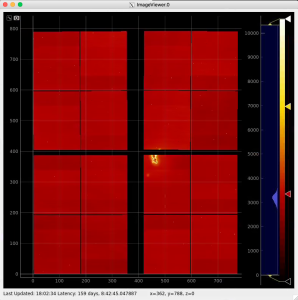
Use geometry with image
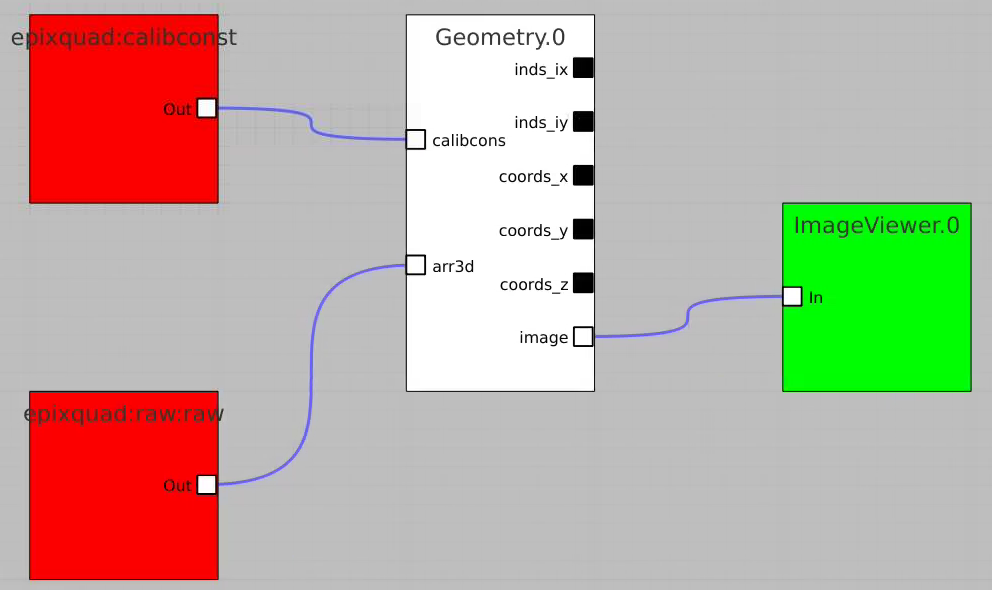
Select optional geometry file
By default geometry data comes from DB associated with experiment or detector. Optional geometry file can be specified through the click on Geometry Control Node editor.
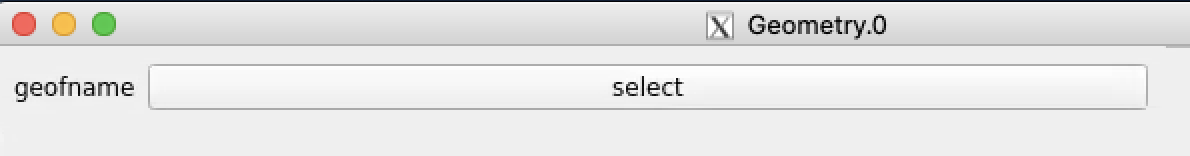
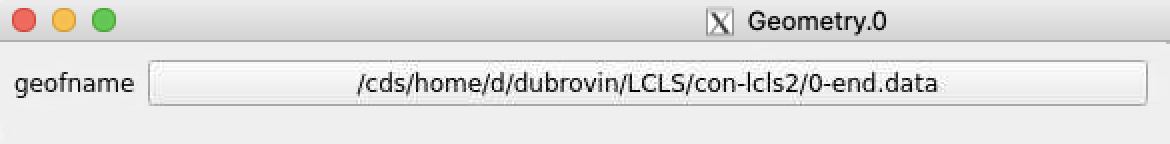
Click on "select" button and select desired geometry file, e.g.
Use Geometry without input array
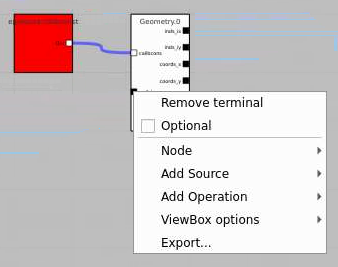
Add the Geometry Control Node as usually and remove input terminal for arr3d. Click on "Apply" and use any geometry output parameters except "image".
References
...
Overview
Content Tools