...
We might expect the network performance to hosts that are in a war zone may be degraded and show up as more variability on the RRTs.A sensitive measure of variability of the RTTs is the Jitter between adjacent measurements. We use a derivation of the Inter Packet Delay Variation (IPDV) to estimate the Jitter from the Ping measurements (see https://www.slac.stanford.edu/comp/net/wan-mon/tutorial.html). In addition we characterize the proximity of the war to a host in Ukraine by its proximity defined as:
| Proximity Description | Value |
| Fallen & occupied by Russian forces | 4 |
| Surrounded by Russian forces | 3 |
| Partially surrrounded by Russian forces | 2 |
| Russian forces nearby | 1 |
| Russian forces not nearby | 0 |
We then plot the IPDV and proximity for each Ukrainian host monitored and look at the correlation between the IPDV and proximity
| IPDV and Proximity for the Ukrainian hosts | Correlation between IPDV and Proximity of Russian forces |
|---|---|
|
|


There is a small positive correlation between the proximity and IPDV.
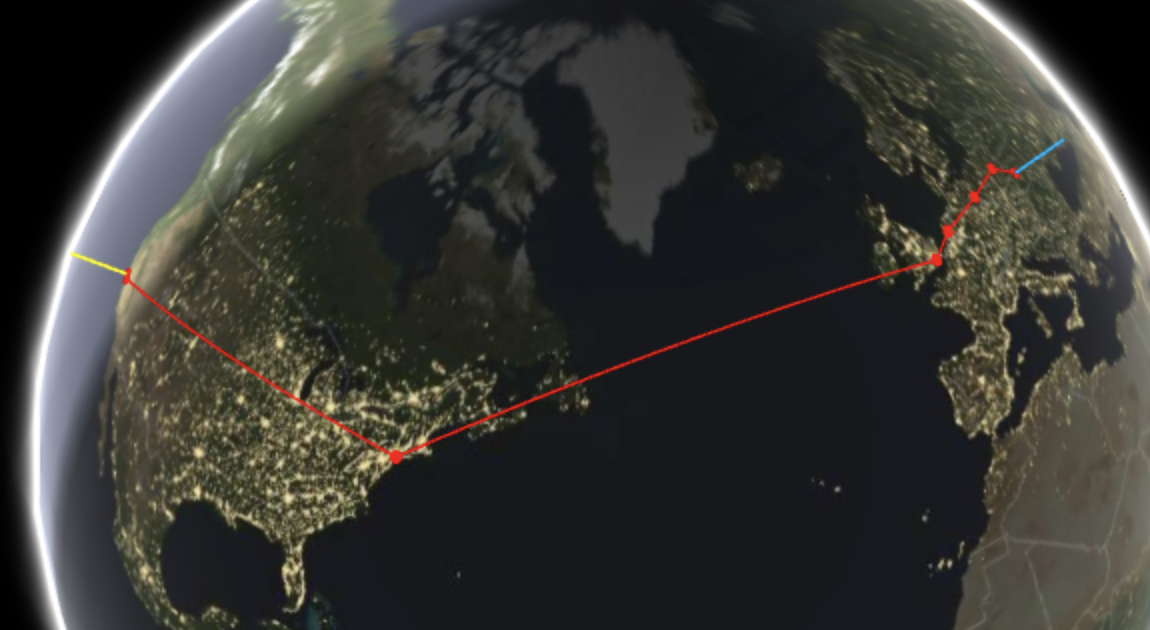
Traceroute to Ukraine
Visual traceroute from San Francisco to https://geotraceroute.com/?host=www.ldufk.edu.ua in Lviv Ukraine
Comparing traceroutes on different days from SLAC to www.ldufk.edu.ua,
Time series for monitored sites
...