...
633997253 x-axis = PtTime-start of run 1st row: evts with Ra,Dec diff between processings 2nd row: evts with same PtPos as prev evt (pro) 3rd row: evts with same PtPos as prev evt (repro) 4th row: evts with same S/C x-axis as prev evt (pro) 5th row: evts with same S/C x-axis as prev evt (repro) 6th row: evts with same S/C z-axis as prev evt (pro) 7th row: evts with same S/C z-axis as prev evt (repro) | |
| 634002957 |
...
Comparison of Pt variables with home-made FT2 interpolation
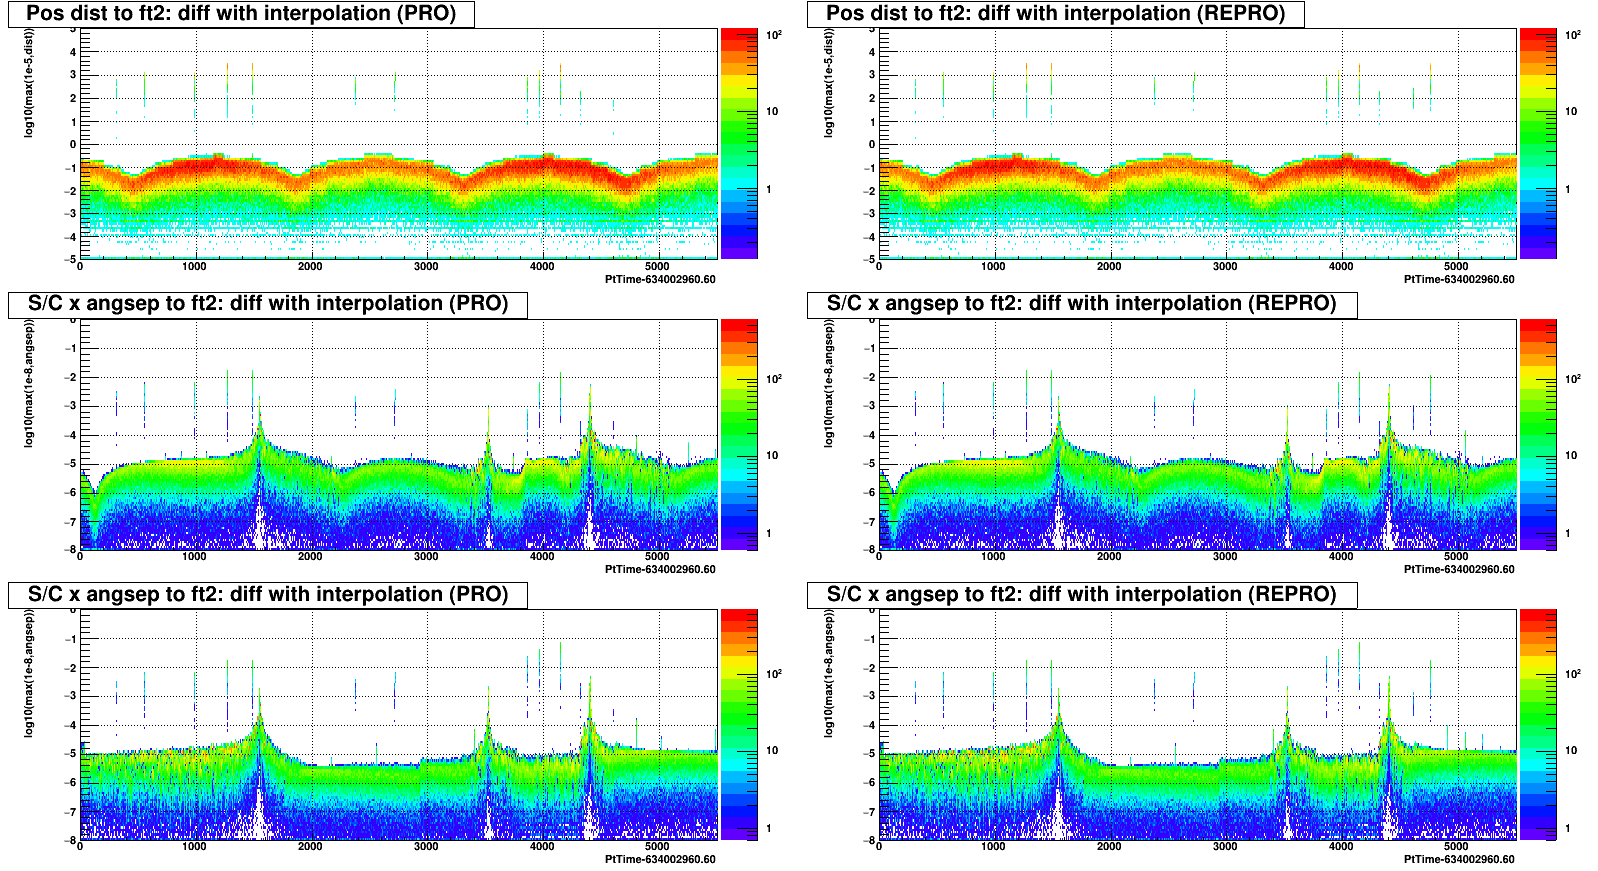
Using the FT2 information, one can predict/interpolate the distance w.r.t. to the position at START and the angular separation w.r.t to the direction at START:
- PtPos
- compute the distance between SC_POSITION at START and at STOP (=START of next event)
- multiply this distance by PtTime-START
- S/C x-axis and z-axis:
- compute the angular separation between S/C direction at START and at STOP (=START of next event)
- multiply this angular separation by PtTime-START
The following plots shows the absolute difference between the measured and predicted quantities:
633997253 left: pro right: repro each variable is computed w.r.t. to ft2 value at START (e.g. the measured pos dist is the distance between the event PtPos and SC_POSITION at START) | |
| 634002957 |
One can see the outliers come in bunches. A lot of bunches are common between pro and repro but some are different.
The pos dist and S/C ang sep outliers are 100% correlated. The most convenient way to detect them is to select abs(pos dist to ft2: diff with interpolation)>1m.


