...
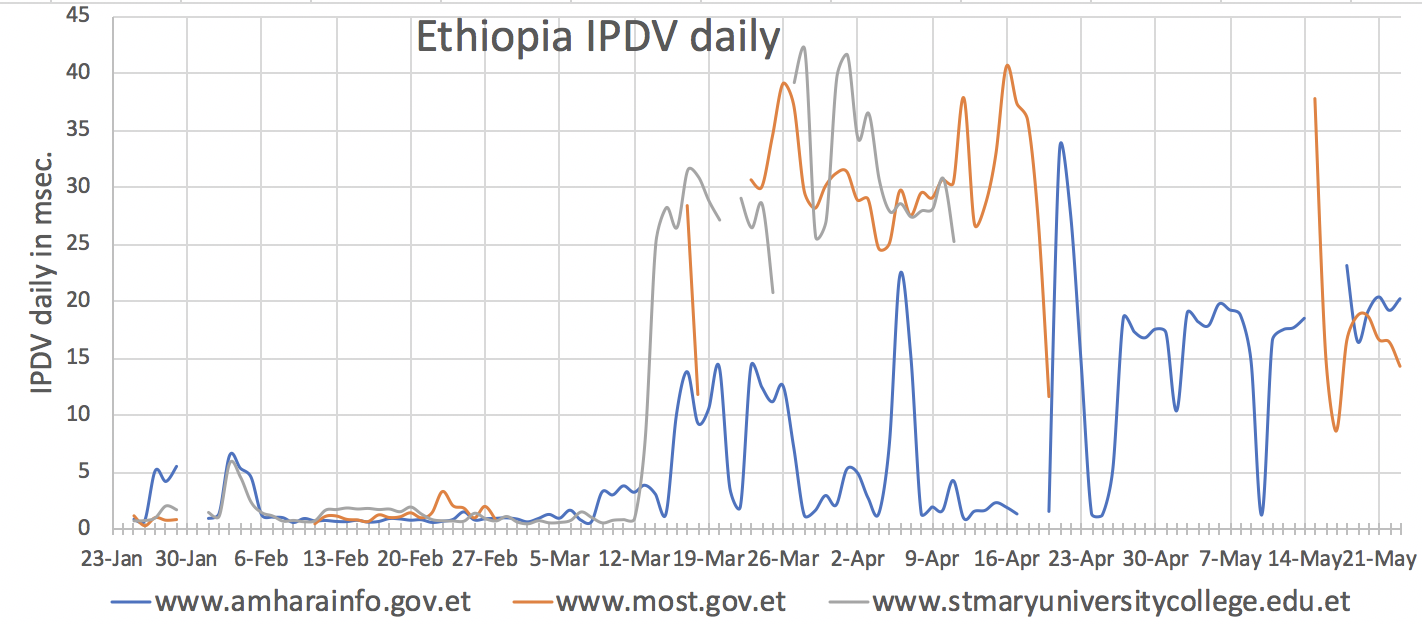
There appears to be a sustained increase in IPDV in Ethiopia around Mar 16 when schools were closed and public gatherings were suspended. Looking in more detail at the 3 hosts monitored in Ethiopia there are 2 government hosts (www.amharainfo.gov.et and www.most.gov.et) and a university. Below we see that all hosts had For www.most.gov.et PingER data is missing for this time period. Below we see www.amharainfo.gov.et and www.stmaryuniversitycollege.edu.et had a sudden rise in IPDV between Mar 12 and Mar 15. See below and the Excel spreadsheet.
According to https://en.wikipedia.org/wiki/COVID-19_pandemic_in_Ethiopia#March_2020 the first Covid-9 case in Ethiopia was on Mar 13. "On 16 March 2020, the office of the Prime Minister announced that schools, sporting events, and public gatherings shall be suspended for 15 days. On 8 April 2020, the Council of Ministers declared a five-month long state of emergency in response to the growing number of coronavirus cases. The state of emergency was approved on 10 April by the parliament".

Kenya
There are 3 hosts being monitored by PingER in Kenya. Two are government hosts both in the capital Nairobi, and one (www.daystar.ac.ke) is the Daystar University in Kampala. Looking at the chart of IPDV below it appears that IPDV dropped by several 10s of a percent sometime between Mar 21 and Mar 28.
From https://en.wikipedia.org/wiki/COVID-19_pandemic_in_Kenya we see: On 15 March 2020, President Uhuru Kenyatta directed that the following measures to curb COVID-19 be implemented:
...
On Mar 25 a nationwide curfew was announced to start on Mar 27. The curfew was extended by 21 days on Apr 25.
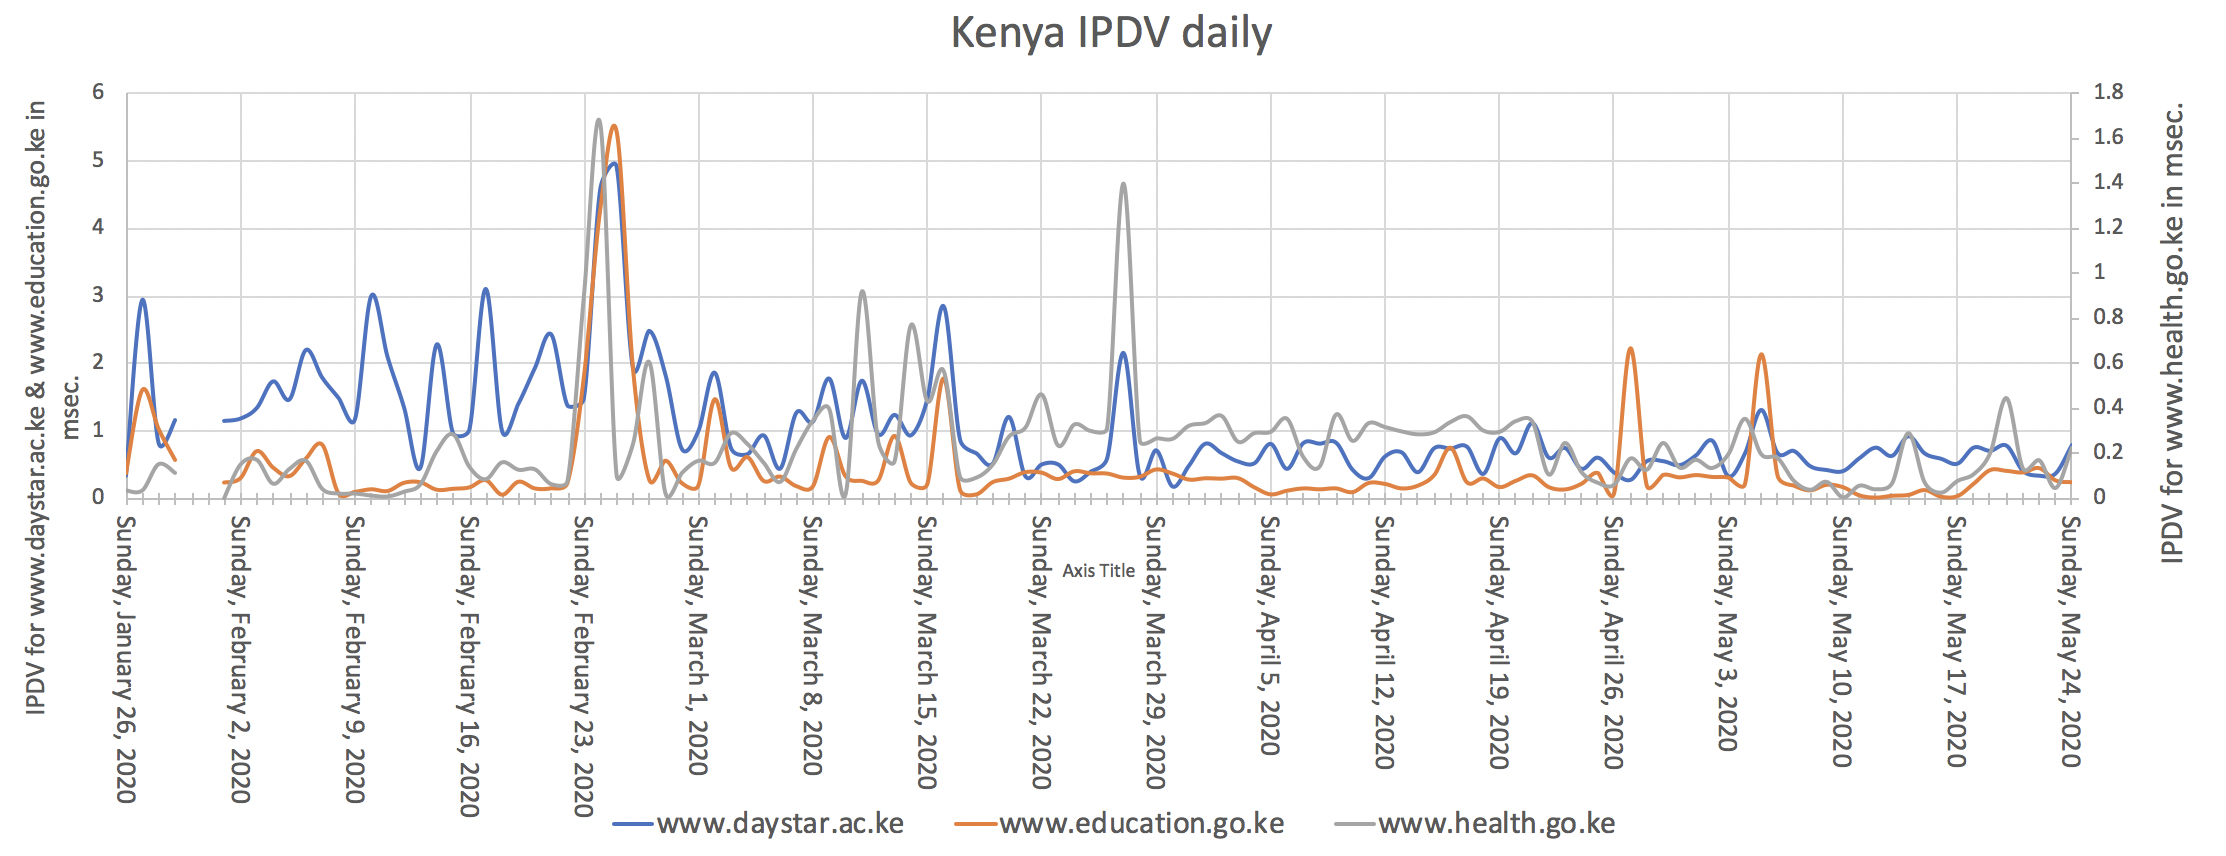
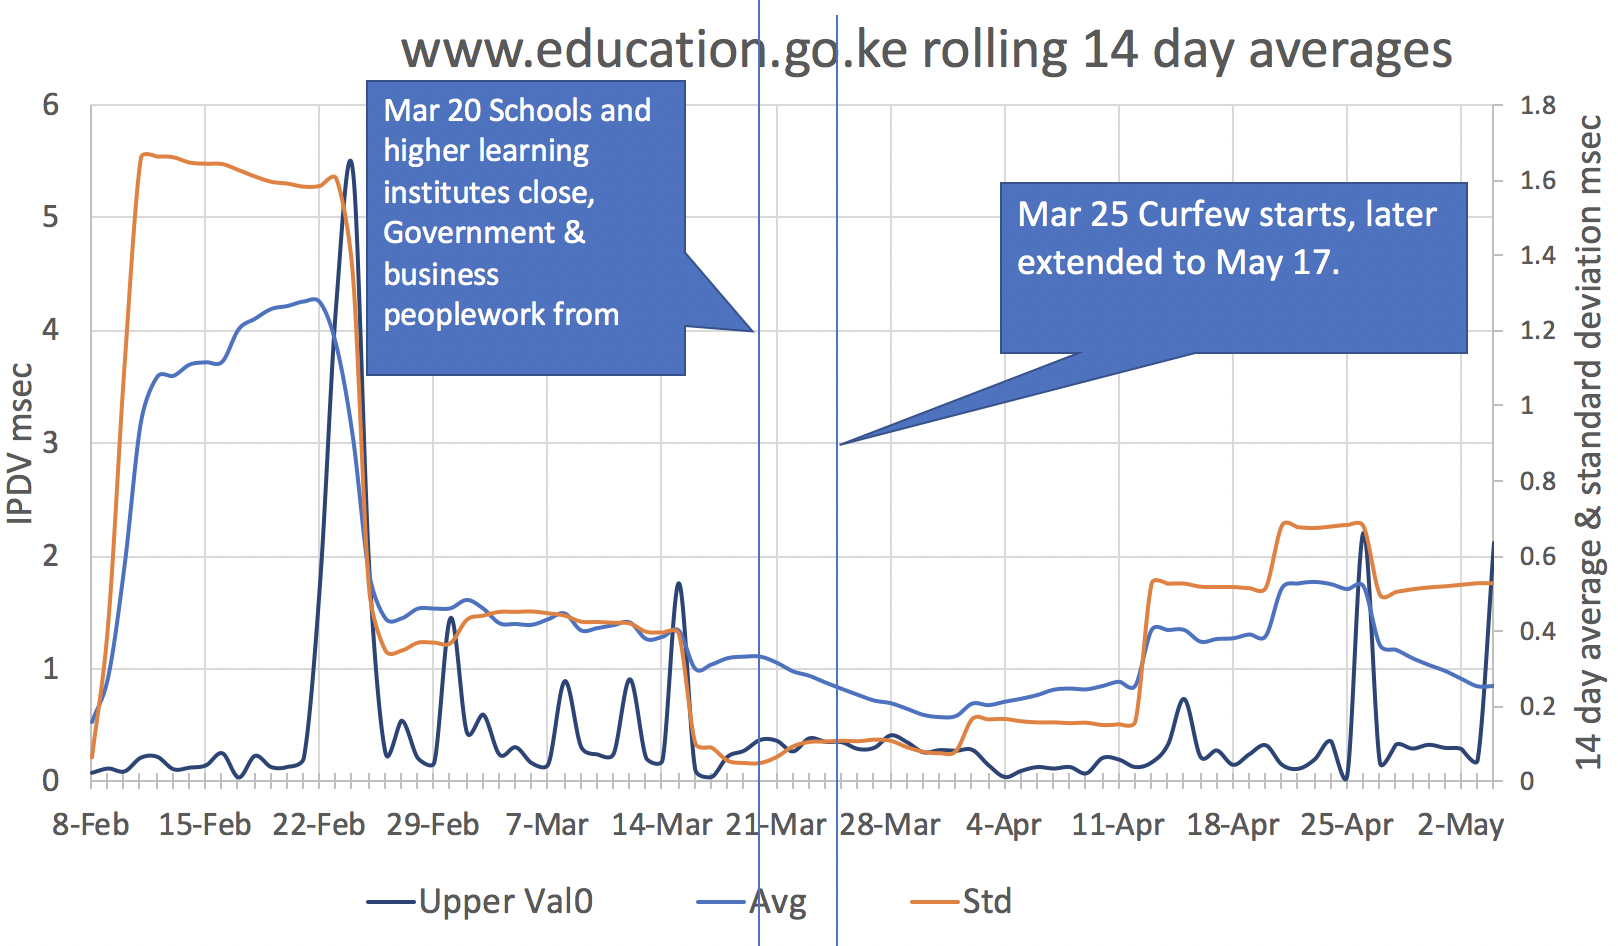
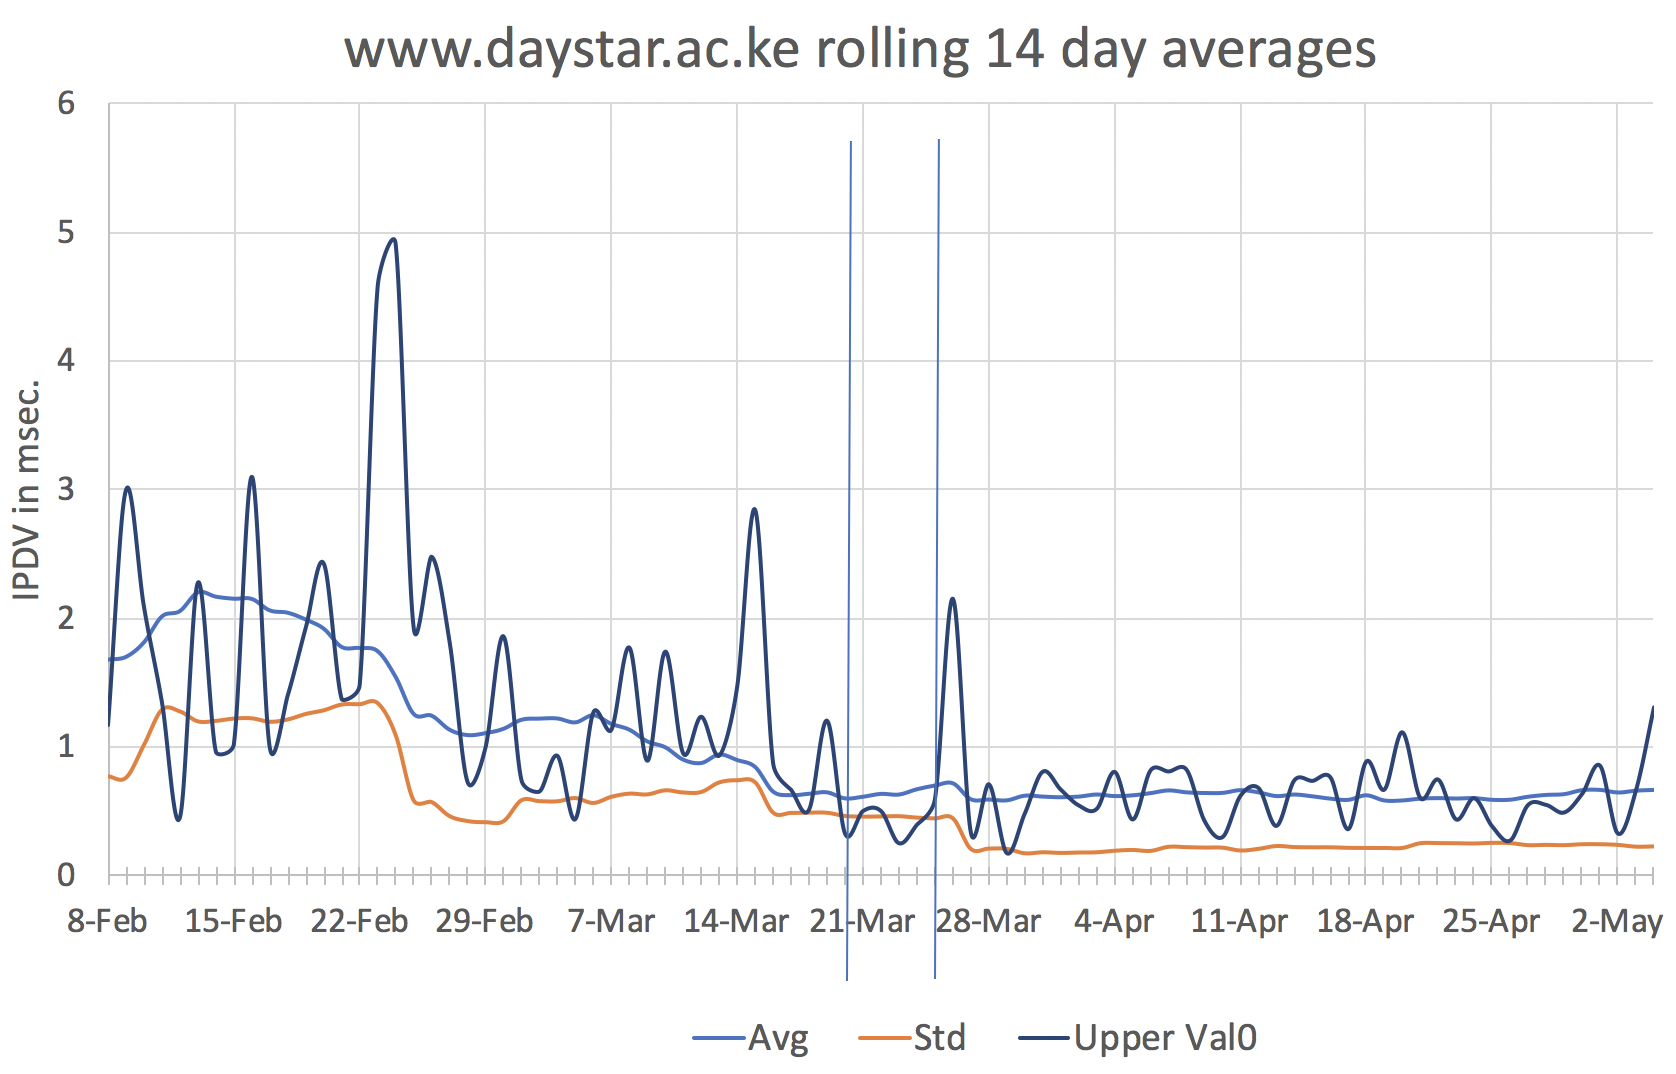
Looking at the charts below it is seen that there is a noticeable reduction in the two-week average IPDV that coincides with the interventions noted.
Kenya details by host
Looking at the averages, standard deviations, (standard deviation/averages) plus the derivatives of the averages, standard and (standard deviation/Average) for 30 days before and after each date, we get the chart charts below. It is seen that within about a week of the interventions the derivatives, in particular, took a sharp rise for all 3 hosts.
...
There is a sustained increase for a few days in IPDV seen by the University of Malawi on Mar 23, however, a similar rise was seen the week before. Similar rises were also seen by www.parliamen.gov.mw. There is a reduction in the overall magnitude and also the variability of IPDV for all hosts for 2 weeks after Apr 19 following the proposed lockdown. However, we can find no change in interventions around this time.

Looking at the 14 day rolling average and standard deviations of the IPDV measurements for www.parliament.gov.mw chart below, we see a roughly factor of 2 drop in the average and standard deviations around the proposed April 18 lockdown.
...