...
I did not filter out non-triggered events, so you'll need to eyeball log plots. Note the ranges are a little different. No gap between 1 and 3. Actually on a log plot there are a few instances of 2.
Addendum 3/8/2006 (RXD)
The odd energy bumps are caused by individual hits:
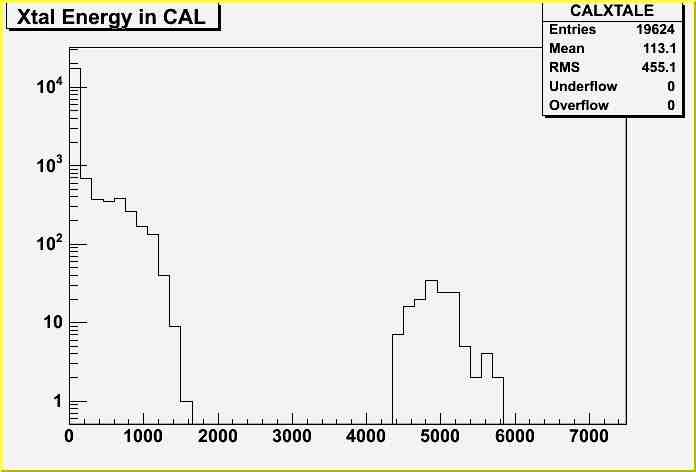
and if I print out some of the hits from CalXtalRecData, I see
| No Format |
|---|
twr, lyr, col = 4 6 11 range 1 ph0 4770.56 E 4770.56
twr, lyr, col = 0 7 0 range 1 ph0 5170.28 E 5170.28
twr, lyr, col = 3 5 9 range 1 ph0 4888.91 E 4888.91
twr, lyr, col = 13 5 6 range 1 ph0 4576.14 E 4576.14
twr, lyr, col = 9 6 1 range 1 ph0 4438.02 E 4438.02
|
If I did this correctly all these baddies are range 1, and I assume maxed out. This may explain the deficit of range 2 crystals. And maybe some effect for getting range 3.
The plots and printout were done with:
| No Format |
|---|
    CalRecon *calRec = rec->getCalRecon();

    if (!calRec) return;

    TObjArray*  xtalCol = calRec->getCalXtalRecCol();
    Long64_t numXtal = xtalCol->GetEntries();
    ((TH1F*)GetObjectPtr("CALXTALCOUNT"))->Fill((Float_t)numXtal);
    float totXE = 0.;
    for (int xc=0;xc<numXtal; xc++) {
      CalXtalRecData* xtal = (CalXtalRecData*)xtalCol->At(xc);
      float xtalEnergy = xtal->getEnergy();
      ((TH1F*)GetObjectPtr("CALXTALE"))->Fill(xtalEnergy);
      if (xtalEnergy > 2000) {
	CalXtalId id = xtal->getPackedId();
	int lyr = id.getLayer();
	int twr = id.getTower();
	int col = id.getColumn();
	CalRangeRecData* rData = xtal->getRangeRecData(0);
	int range = rData->getRange(0);
	double ph0 = xtal->getEnergySelectedRange(range,0);
	std::cout << "twr, lyr, col = " << twr << " " << lyr << " " << col <<
	  " range " << range << " ph0 " << ph0 << " E " << xtalEnergy << std::endl;

	continue;
      }
      totXE += xtalEnergy;
    }
    ((TH1F*)GetObjectPtr("CALXTALTOTE"))->Fill(totXE);
|