...
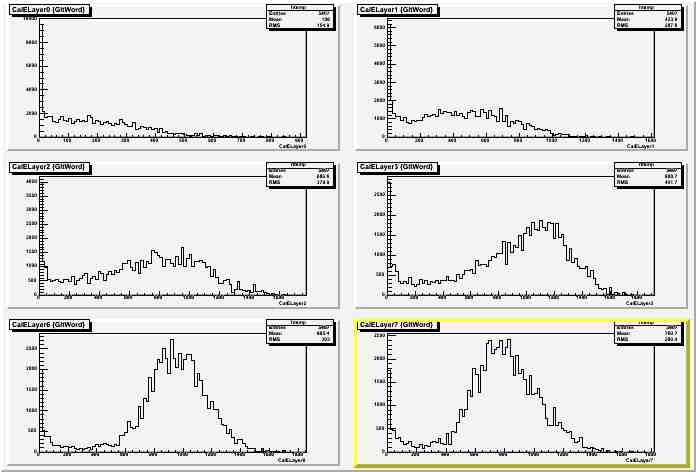
indicates that the satellite peaks are uncorrelated. These plots look like the biggest clue. The layer energies, aside from zero, are all wrong, as seen from the last pre-new-CAL release (v6r2p8) (Merit tuple from systests 10 GeV gammas; GltWord>0):
For comparison, here are more plots from v6r2p8:
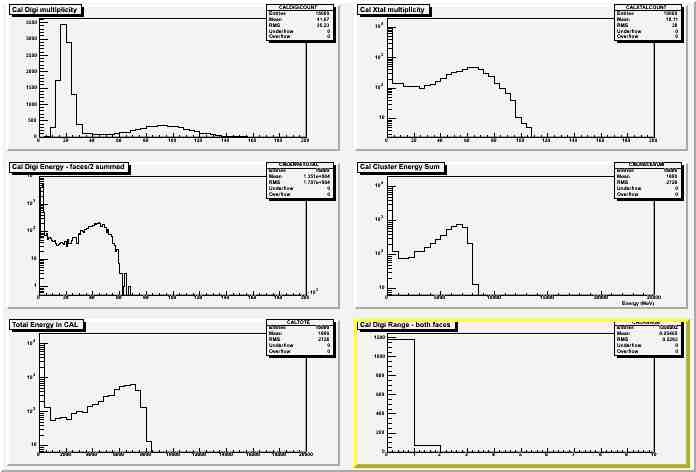
I did not filter out non-triggered events, so you'll need to eyeball log plots. Note the ranges are a little different. No gap between 1 and 3. Actually on a log plot there are a few instances of 2.