...
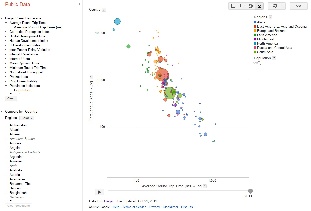
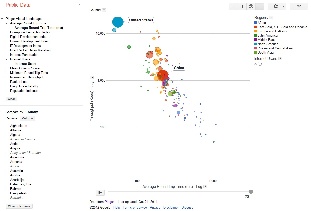
Default view | Highlighted countries with |
|---|---|
|
|
Usage
By default the pinger data explorer shows the bubble chart between throughput in log scale to average_rtt in log scale. Each bubble represents a country. The size of the bubble shows population of the country. The color of the bubble shows the region of the country. The motion is the time. The time granularity is by the year. Click on the play button to initiate motion.
...
The scripts and files are placed at /afs/slac.stanford.edu/package/pinger/explorer . Two scripts have to be run for generating the data file in the format required by the google data explorer. First script is generate-metric-files-for-explorer.pl . This script takes metric values from prmout folder (http://www-iepm.slac.stanford.edu/pinger/prmout/ AKA /afs/slac/g/www/www-iepm/pinger//prmout (you can use ls -lt /afs/slac/g/www/www-iepm/pinger/prmout/ | grep SLAC | grep allyear | more to find the latest relevant files, you can use ls -lt /afs/slac/g/www/www-iepm/pinger//prmout/ | grep SLAC | grep allyear | more to find the latest relevant files) and transposes the data such that years are now incremented vertically and not horizontally. The files generated by generate-metric-files-for-explorer.pl see below) and transposes the data such that years are now incremented vertically and not horizontally.
ls -lt /afs/slac/g/www/www-iepm/pinger//prmout/ | grep SLAC | grep allyear | more
-rw-rw-rw- 1 cottrell sf 17108 Jan 4 09:26 unreachability-EDU.SLAC.STANFORD.N3-country-allyearly.csv
-rw-rw-rw- 1 cottrell sf 18886 Jan 4 09:23 ipdv-EDU.SLAC.STANFORD.N3-country-allyearly.csv
-rw-rw-rw- 1 cottrell sf 18524 Jan 4 09:20 packet_loss-EDU.SLAC.STANFORD.N3-country-allyearly.csv
-rw-rw-rw- 1 cottrell sf 21477 Jan 4 09:16 minimum_rtt-EDU.SLAC.STANFORD.N3-country-allyearly.csv
-rw-rw-rw- 1 cottrell sf 18099 Jan 4 09:13 alpha-EDU.SLAC.STANFORD.N3-country-allyearly.csv
-rw-rw-rw- 1 cottrell sf 15112 Jan 4 09:06 MOS-EDU.SLAC.STANFORD.N3-country-allyearly.csv
-rw-rw-rw- 1 cottrell sf 30900 Jan 4 08:48 nthroughput-EDU.SLAC.STANFORD.N3-country-allyearly.csv
-rw-rw-rw- 1 cottrell sf 21426 Jan 4 08:30 throughput-EDU.SLAC.STANFORD.N3-country-allyearly.csv
-rw-rw-rw- 1 cottrell sf 21561 Jan 4 08:27 average_rtt-EDU.SLAC.STANFORD.N3-country-allyearly.csv
-rw-rw-rw- 1 pinger sf 3359 Jan 4 08:08 nthroughput-EDU.SLAC.STANFORD.N3-continent-allyearly.csv
-rw-rw-rw- 1 pinger sf 2190 Jan 4 08:02 minimum_rtt-EDU.SLAC.STANFORD.N3-continent-allyearly.csv
-rw-rw-rw- 1 pinger sf 1837 Jan 4 07:58 ipdv-EDU.SLAC.STANFORD.N3-continent-allyearly.csv
-rw-rw-rw- 1 pinger sf 2196 Jan 4 07:53 average_rtt-EDU.SLAC.STANFORD.N3-continent-allyearly.csv
-rw-rw-rw- 1 pinger sf 1253 Jan 4 07:49 MOS-EDU.SLAC.STANFORD.N3-continent-allyearly.csv
-rw-rw-rw- 1 pinger sf 1754 Jan 4 07:43 unreachability-EDU.SLAC.STANFORD.N3-continent-allyearly.csv
-rw-rw-rw- 1 pinger sf 2225 Jan 4 07:39 throughput-EDU.SLAC.STANFORD.N3-continent-allyearly.csv
-rw-rw-rw- 1 pinger sf 1824 Jan 4 07:34 packet_loss-EDU.SLAC.STANFORD.N3-continent-allyearly.csv
-rw-rw-rw- 1 pinger sf 1485 Jan 4 2014 alpha-EDU.SLAC.STANFORD.N3-continent-allyearly.csv
The above files are updated using the command:
/afs/slac/package/pinger/analysis/wrap-analyze-allyears.pl --basedir /nfs/slac/g/net/pinger --usemetric --dataset hep --set_metric 4
that is run quarterly from a trscontab file, thus you should not need to do anything.
The files generated by generate-metric-files-for-explorer.pl are:
326cottrell@rhel6-64i:~$ls -lt /afs/slac.stanford.edu/package/pinger/explorer
total 639
-rw-rw-r-- 1 amberzeb sg 36293 Jan 4 09:37 MOS.csv
-rw-rw-r-- 1 amberzeb sg 42913 Jan 4 09:37 average_rtt.csv
-rw-rw-r-- 1 amberzeb sg 40238 Jan 4 09:37 ipdv.csv
-rw-rw-r-- 1 amberzeb sg 42829 Jan 4 09:37 minimum_rtt.csv
-rw-rw-r-- 1 amberzeb sg 51327 Jan 4 09:37 nthroughput.csv
-rw-rw-r-- 1 amberzeb sg 39876 Jan 4 09:37 packet_loss.csv
-rw-rw-r-- 1 amberzeb sg 40887 Jan 4 09:37 throughput.csv
-rw-rw-r-- 1 amberzeb sg 35982 Jan 4 09:37 unreachability.csv
These are then given as an input to the script generate-alldata-for-pinger-data-explorer.pl, which outputs the data for all the metrics altogether in one file named file.csv. This file is in the format as required by the google data explorer.
The metric files placed in prmout, for example, average_rtt-EDU.SLAC.STANFORD.N3-country-allyearly.csv have the data in the format shown below:
| Code Block |
|---|
allyearly,?,1998,1999,2000,2001,2002,2003,2004,2005,2006,2007,2008,2009,2010,2011
EDU.SLAC.STANFORD.N3-to-Afghanistan,.,.,.,.,.,.,.,.,.,.,767.453,732.841,728.492,750.940,743.080
EDU.SLAC.STANFORD.N3-to-Albania,.,.,.,.,.,.,.,.,.,.,.,234.933,235.681,254.324,225.474
EDU.SLAC.STANFORD.N3-to-Algeria,.,.,.,.,.,.,.,.,197.772,271.337,354.233,242.616,369.479,224.162,239.514
EDU.SLAC.STANFORD.N3-to-Andorra,.,.,.,.,.,.,.,.,.,.,171.471,166.487,172.334,180.878,181.307
EDU.SLAC.STANFORD.N3-to-Angola,.,.,.,.,.,.,.,.,.,622.280,610.272,642.821,556.701,617.649,.
EDU.SLAC.STANFORD.N3-to-Argentina,.,.,.,.,.,.,.,.,.,210.563,196.282,269.567,284.886,285.094,310.711
EDU.SLAC.STANFORD.N3-to-Armenia,.,.,.,.,.,.,553.942,433.564,590.536,613.230,532.564,370.588,255.761,248.554,237.400
EDU.SLAC.STANFORD.N3-to-Australia,.,.,.,.,.,.,.,.,.,211.440,193.981,180.105,181.620,190.176,179.072
EDU.SLAC.STANFORD.N3-to-Austria,.,.,.,.,.,.,.,.,.,.,180.361,185.830,178.831,180.726,180.207
EDU.SLAC.STANFORD.N3-to-Azerbaijan,.,.,.,.,.,.,.,.,.,.,.,257.763,269.463,256.694,252.713
EDU.SLAC.STANFORD.N3-to-Bahamas,.,.,.,.,.,.,.,.,.,.,.,109.626,110.701,817.097,112.252
EDU.SLAC.STANFORD.N3-to-Bahrain,.,.,.,.,.,.,.,.,.,.,664.547,333.670,316.139,313.444,295.960
EDU.SLAC.STANFORD.N3-to-Bangladesh,.,.,.,.,.,1562.224,1222.391,1039.782,1084.855,842.794,545.756,496.707,426.840,350.780,371.552
EDU.SLAC.STANFORD.N3-to-Belarus,.,.,.,.,.,.,1770.143,2322.474,227.052,206.936,205.880,222.485,258.829,281.173,205.689
EDU.SLAC.STANFORD.N3-to-Belgium,.,.,.,.,.,.,.,.,.,.,158.697,160.445,158.798,164.117,160.686
EDU.SLAC.STANFORD.N3-to-Benin,.,.,.,.,.,.,.,.,417.760,535.608,382.265,366.215,485.181,377.928,331.121
EDU.SLAC.STANFORD.N3-to-Bhutan,.,.,.,.,.,.,.,.,.,.,.,622.936,356.257,327.709,332.479
EDU.SLAC.STANFORD.N3-to-Bolivia,.,.,.,.,.,.,.,.,.,381.975,368.615,304.993,262.934,227.907,202.485
EDU.SLAC.STANFORD.N3-to-Bosnia Herzegovina,.,.,.,.,.,.,.,.,.,.,207.925,209.180,194.950,203.405,204.102
EDU.SLAC.STANFORD.N3-to-Botswana,.,.,.,.,.,.,.,.,.,.,.,.,416.286,431.282,443.501
EDU.SLAC.STANFORD.N3-to-Brazil,.,.,.,.,.,195.192,213.593,246.179,279.903,208.264,229.659,236.297,238.008,237.791,236.176
EDU.SLAC.STANFORD.N3-to-Brunei,.,.,.,.,.,.,.,309.591,498.171,339.716,269.697,285.392,266.995,265.540,296.008
EDU.SLAC.STANFORD.N3-to-Bulgaria,.,.,.,.,.,.,.,.,.,.,193.049,211.796,202.603,205.785,200.523
EDU.SLAC.STANFORD.N3-to-Burkina Faso,.,.,.,.,.,.,1006.037,1004.097,904.836,765.485,306.416,339.176,321.502,367.969,330.849
EDU.SLAC.STANFORD.N3-to-Burundi,.,.,.,.,.,.,.,.,.,889.260,845.340,665.150,666.138,670.703,686.103
EDU.SLAC.STANFORD.N3-to-Cambodia,.,.,.,.,.,.,.,.,.,.,261.756,253.511,253.505,225.453,233.720
|
The script generate-metric-files-for-explorer.pl converts the metric files in the format below:
| Code Block |
|---|
AFG,1998,
AFG,1999,
AFG,2000,
AFG,2001,
AFG,2002,
AFG,2003,
AFG,2004,
AFG,2005,
AFG,2006,
AFG,2007,767.453
AFG,2008,732.841
AFG,2009,728.492
AFG,2010,750.940
AFG,2011,743.080
ALB,1998,
ALB,1999,
ALB,2000,
ALB,2001,
ALB,2002,
ALB,2003,
ALB,2004,
ALB,2005,
ALB,2006,
ALB,2007,
ALB,2008,234.933
ALB,2009,235.681
ALB,2010,254.324
ALB,2011,225.474
DZA,1998,
DZA,1999,
|
...