...
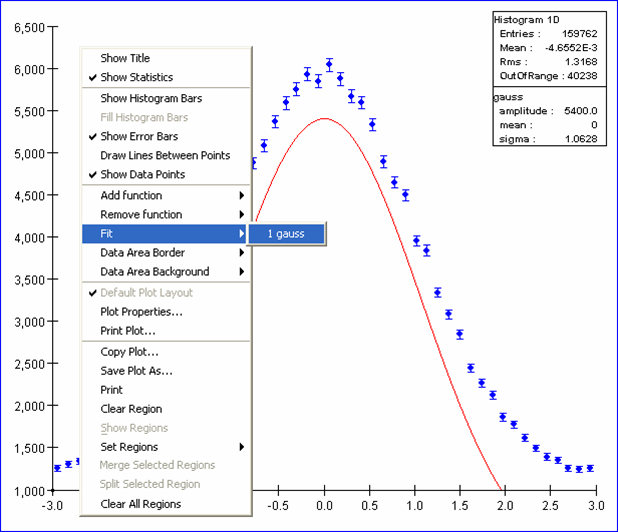
To perfom the fit right click on the plot and under the Fit menu item select the function to be fitted (if multiple functions are present on the plot it is possible to choose which one to fit).
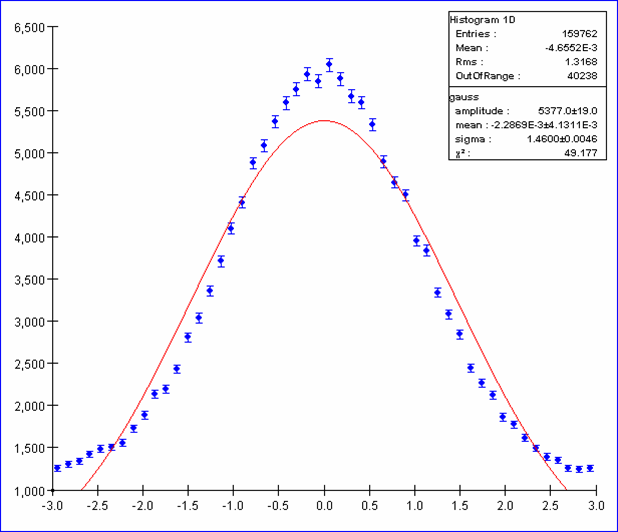
Once the fit has been performed the statistics box will show the error on the fitted parameters and the chi square of the fit. In the figure below we have a pretty bad fit; the plot is showing the sum of two gaussians so we should now try to add the second one, add the two functions together, fix the two means and fit again.
Once the second gaussian has been added to sum the two together select Sum of existing functions under the Add Function menu item on the popup menu as shown below: