...
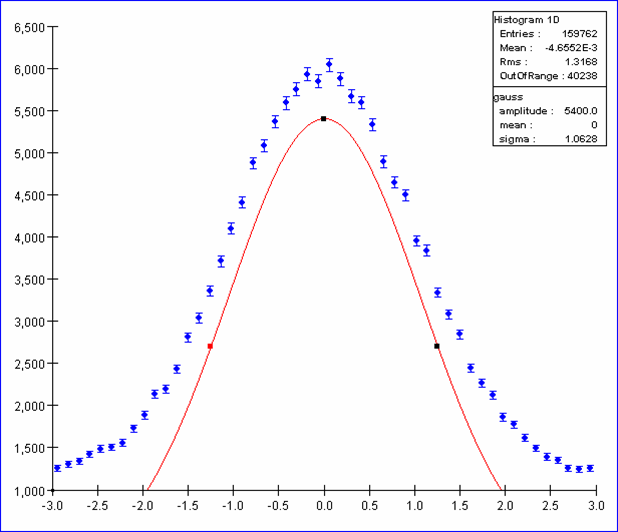
When adding the function, the function's parameters are calculated internally using the plot's properties in order for the function to fit the screen. The user can then change the function's parameters by moving a set of handles that appear on the function itself. Normally the handles appear as black squares on the function's outline. When the mouse enters an handle's area, the color of the handle switches to red and the cursor changes accordingly in order to show the type of action that is allowed on the selected handle. In the plot below the handle that controls the sigma of the gaussian has been selected and ; the cursor shows should show that only horizontal movements are allowed:
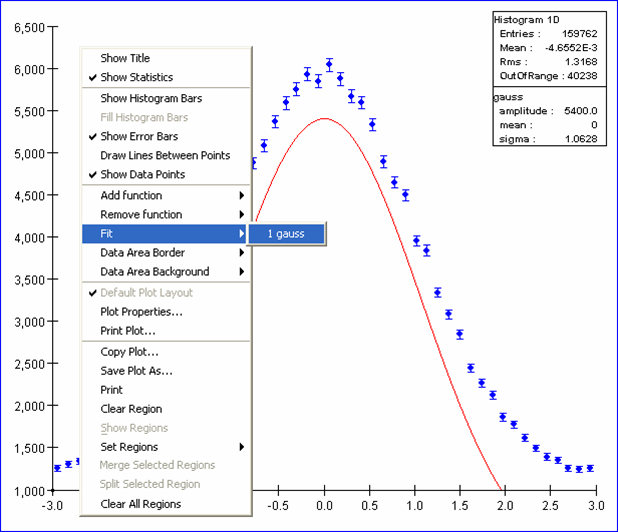
To perfom the fit right click on the plot and under the Fit menu item select the function to be fitted (if multiple functions are present on the plot it is possible to choose which one to fit).
 !Function Added To Plot!