...
To get a better view of the situation, we try to look at the reverse route i.e from pinger.uettaxila.edu.pk to monitor.niit.edu.pk. The smokeping graph thus obtained is: 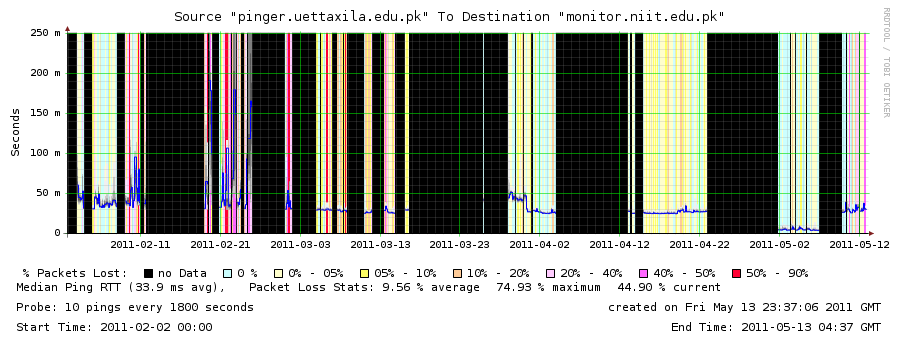
The smokeping graph shows that the node was showing a fluctuating UP/DOWN behavior during the last three months. However, the drop in Avg_RTT is observed here also (see at 2011-05-02).
Looking at the traceroutes from pinger.uettaxila.edu.pk to monitor.niit.edu.pk on one of the days of low Avg_RTT (here 5/1/2011) following output is observed:
...