Previous week Next week
Calorimeter trending plots
Dates use for trending week: MET (s) 563152000 to 563756800 (UTC 2018-11-05 23:06:35.0 to 2018-11-12 23:06:35.0)
Pedestals, thresholds, light asymmetry slope, and charge peaks for previous six months and mission lifetime. Pedestal quantities being trended are pedestal difference from reference epoch and pedestal rms. Thresholds are trended in MeV units for LAC, FLE, and FHE, and in ADC units for all three ranges of ULD transition.
2D histograms contain 1536 or 3072 values per time slice. Each time slice is one week. Value indicated is average over one week.
(Note: starting with 31 May 2018 trending week, the 'mission long' ULD plots are no longer truly mission long, and instead cover only the current week and previous 501 weeks. I [Tyrel] have not been able to determine why Sasha's scripts have a problem for these values but not for the other mission long plots.)
24-week plots
Reference epoch is Quarterly Review 3 to 6-epsilon months in the past.
Pedestals: 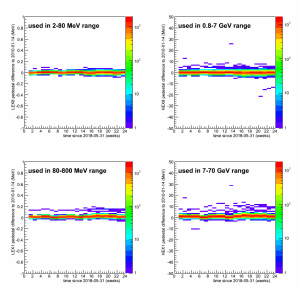
Pedestal widths: 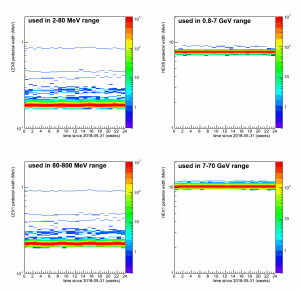
LAC thresholds: 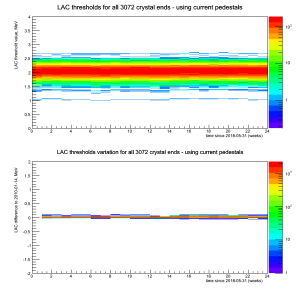
FLE thresholds: 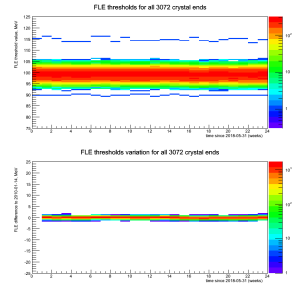
FHE thresholds: 
ULD thresholds - LEX8: 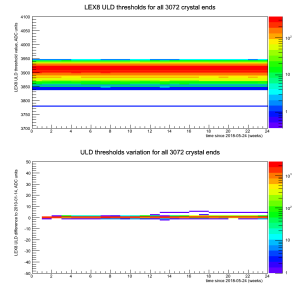
ULD thresholds - LEX1: 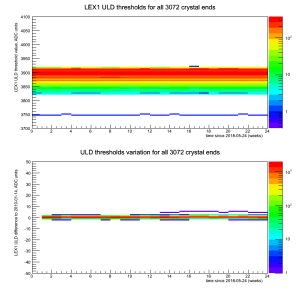
ULD thresholds - HEX8: 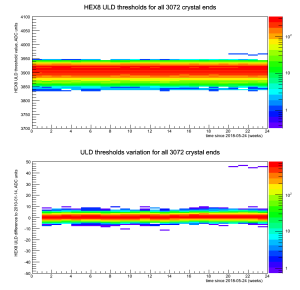
Mission Life Plots
Pedestals: 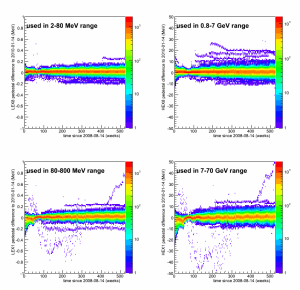
Pedestal widths: 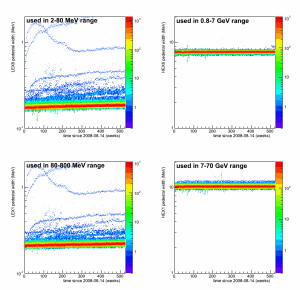
LAC thresholds: 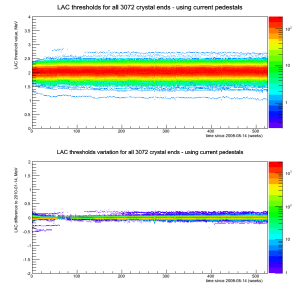
FLE thresholds: 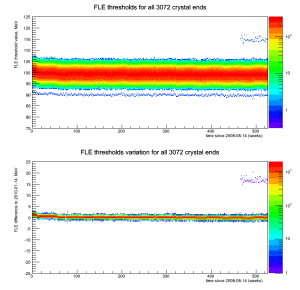
FHE thresholds: 
ULD thresholds - LEX8: 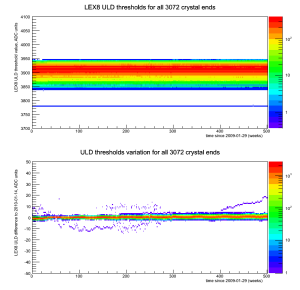
ULD thresholds - LEX1: 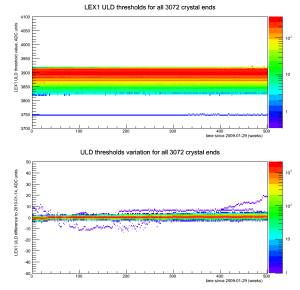
ULD thresholds - HEX8: 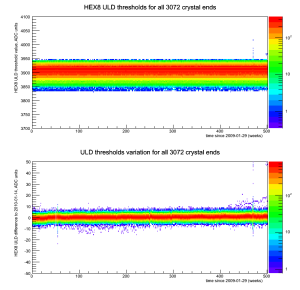
Averaged Values (in MJD) from David Sanchez
LAC pos thresholds: 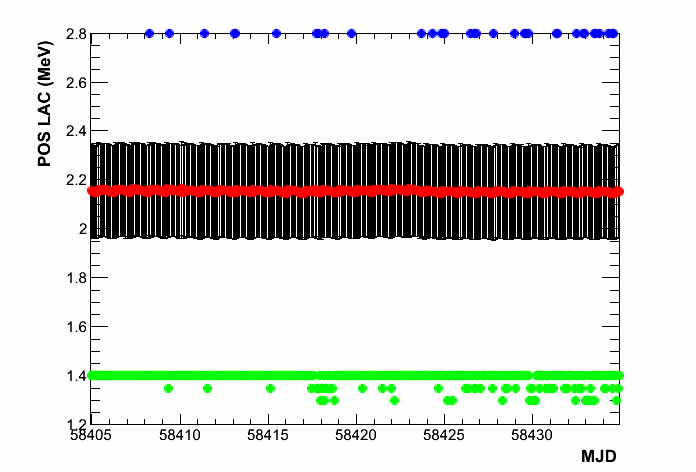
LAC neg thresholds: 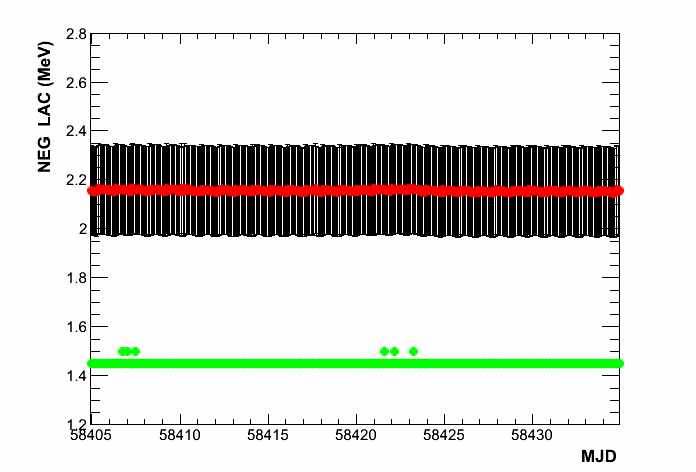
FLE thresholds: 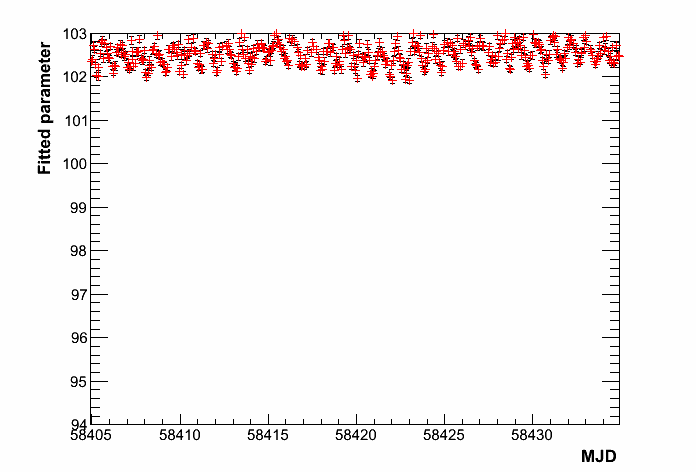
FHE thresholds: 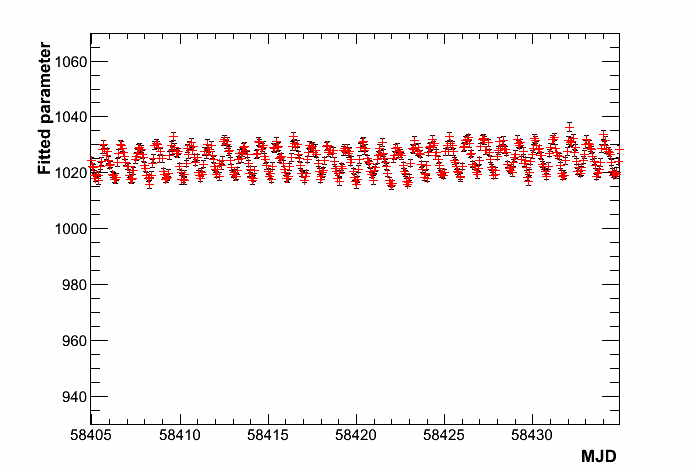
Mean Pedestal Deviations - LEX 8 : 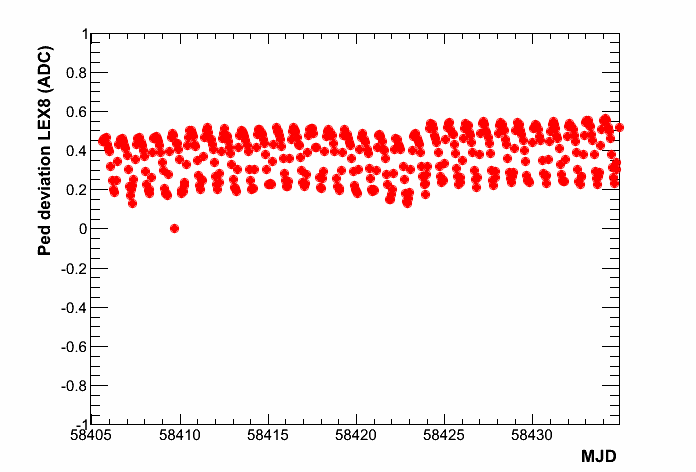 Pedestal Deviation Spread:
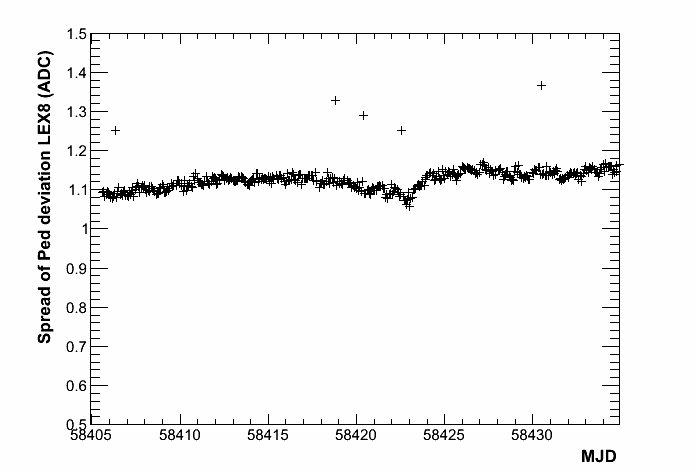
Mean Pedestal Deviations - LEX 1 : 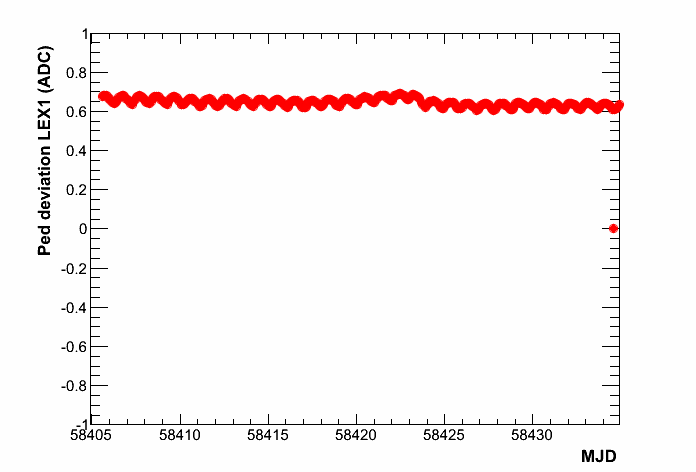 Pedestal Deviation Spread:
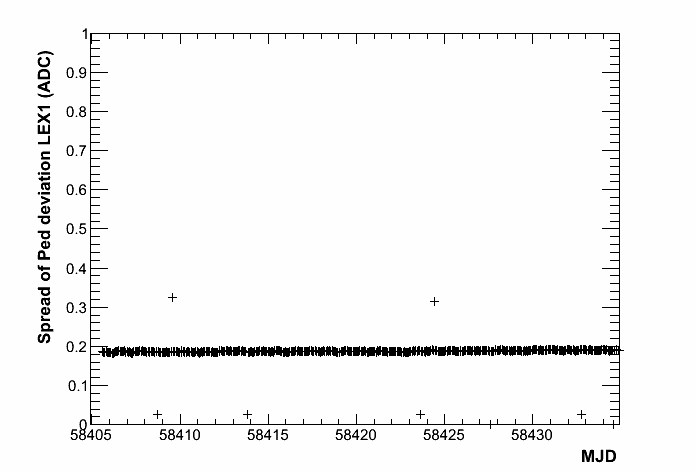
Mean Pedestal Deviations - HEX 8 : 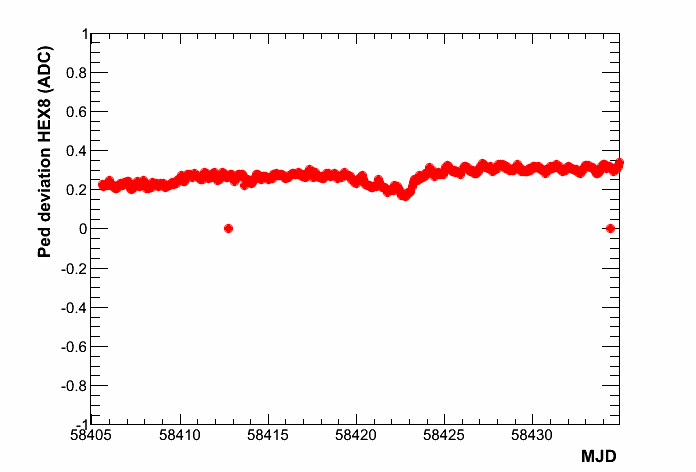 Pedestal Deviation Spread:
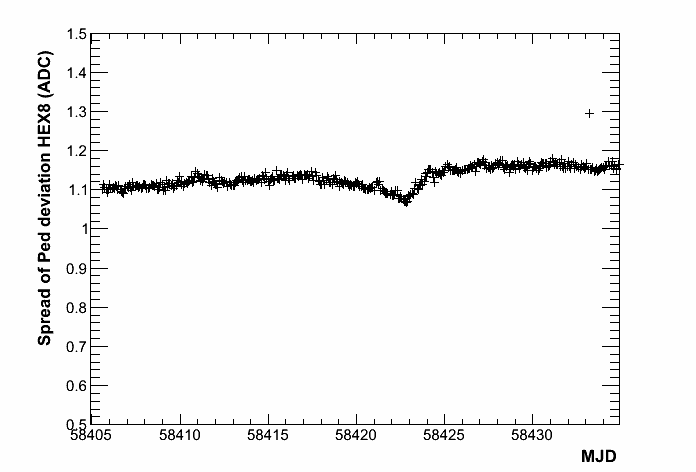
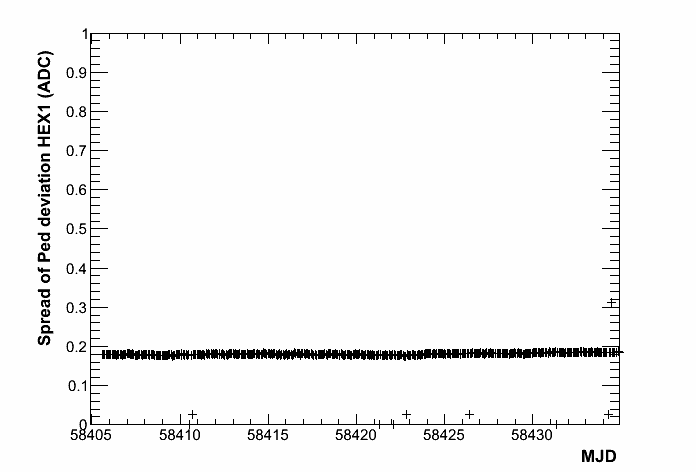
Mean Pedestal Deviations - HEX 1 : 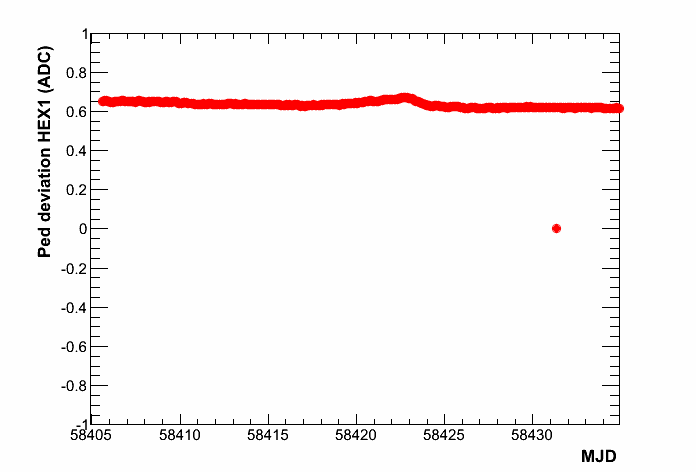 Pedestal Deviation Spread: