Page History
Contents
| Table of Contents |
|---|
Online Analysis Tutorial - presented at SSRL/LCLS User's conference, 2014
Online Analysis Design
Online Analysis Design - Presentation by Matt for January 2012 DAQ Meeting
...
| Anchor | ||||
|---|---|---|---|---|
|
Online Monitoring GUI
...
Using the Online Monitoring GUI
...
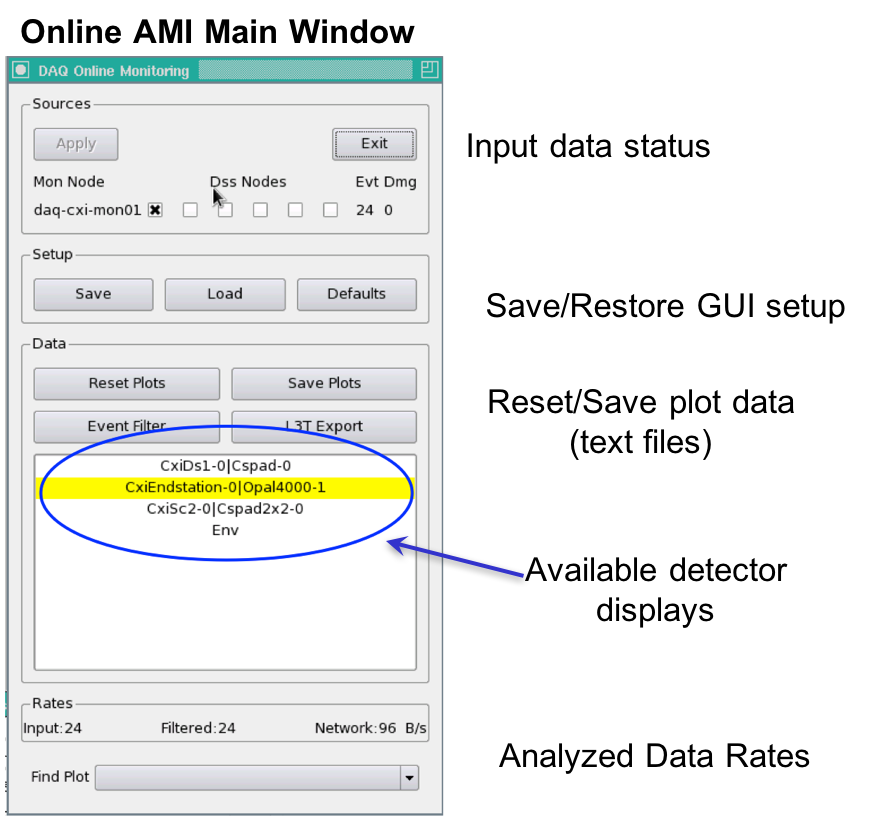
"Restart DAQ" icon on operator console brigns up multiple GUI panels for DAQ system. Online Monitoring GUI is as shown below:
?
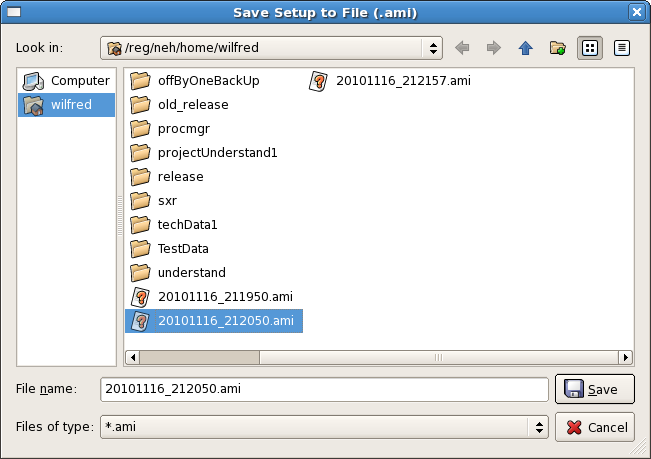
Setup : This section deals with setting up various display windows for online monitoring. "Save" control provides a way to archive configuration of current display windows. (X-Y plots, 2-D frame etc.) Whereas, "Load" control retrives existing display windows configuration. Display configuration is saved in file with extension ".ami" as shown in following figure.
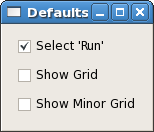
"Defaults" control provides users a feature to set specific settings (show grid/minor grid etc.) of online monitoring plots as default.
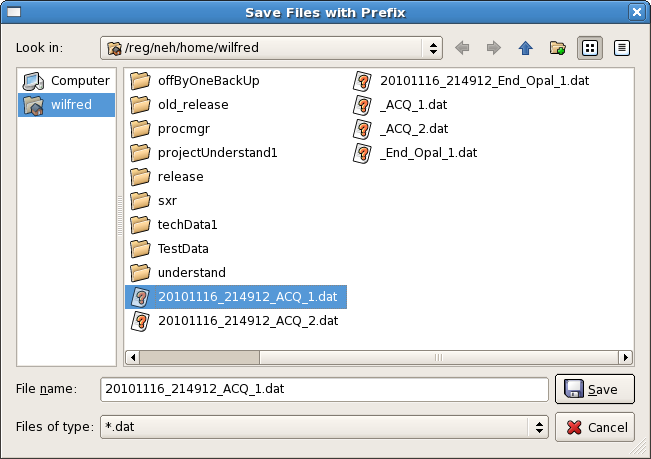
Data: This section provides various features for data in various plots. "Reset Plots" control will reset the all displayed plots by clearing their content and restart ploting with new set of data. Users can save plots using "Save Plots" control available in this section. Plot data will be saved as ".dat" file in terms of values associated with its axis.
For X-Y plot (Acqiris Digitizer Waveform), contents of saved plot will be saved as value vectors of X and Y axis in a ".dat" file as shown below:
| No Format |
|---|
1.5e-09  0.000561523
2.5e-09  0.000170898
3.5e-09  0.000170898
4.5e-09  0.000366211
5.5e-09  -0.000195313
6.5e-09  0.000268555
7.5e-09  7.32422e-05
8.5e-09  0.000366211
9.5e-09  7.32422e-05
1.05e-08 7.32422e-05
:
:
|
List of primary event displays is shown at the bottom part of the "Online Monitoring Window". This list reflects various detectors involved in current run of experiment. A mouse click on specic event display will openup corresponding data monitoring plot. Each type of data plots has multiple features attched to it which will be covered in following section.
??
Details of Scalar variables/data
?
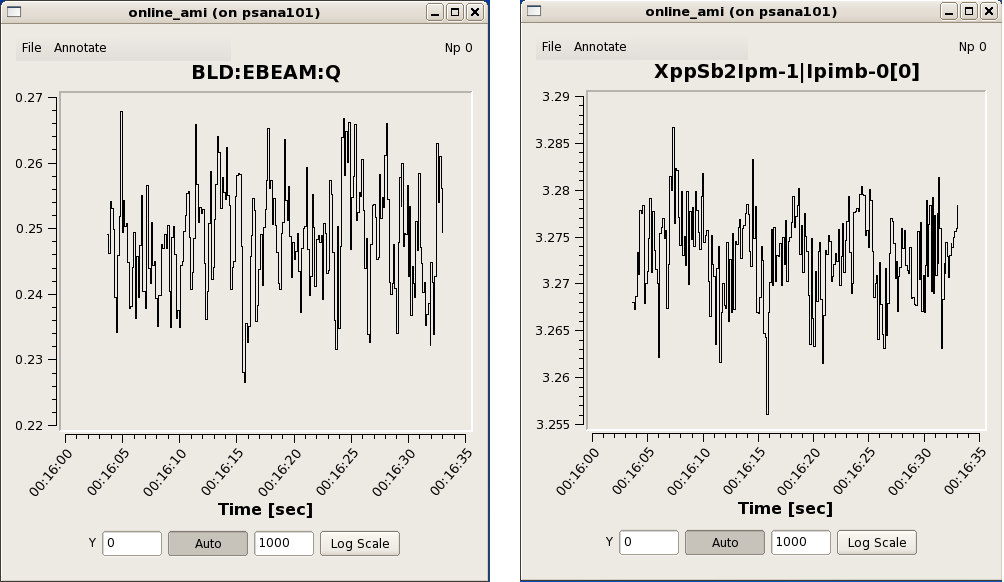
Ebeam and Ipimb data view details
?
?
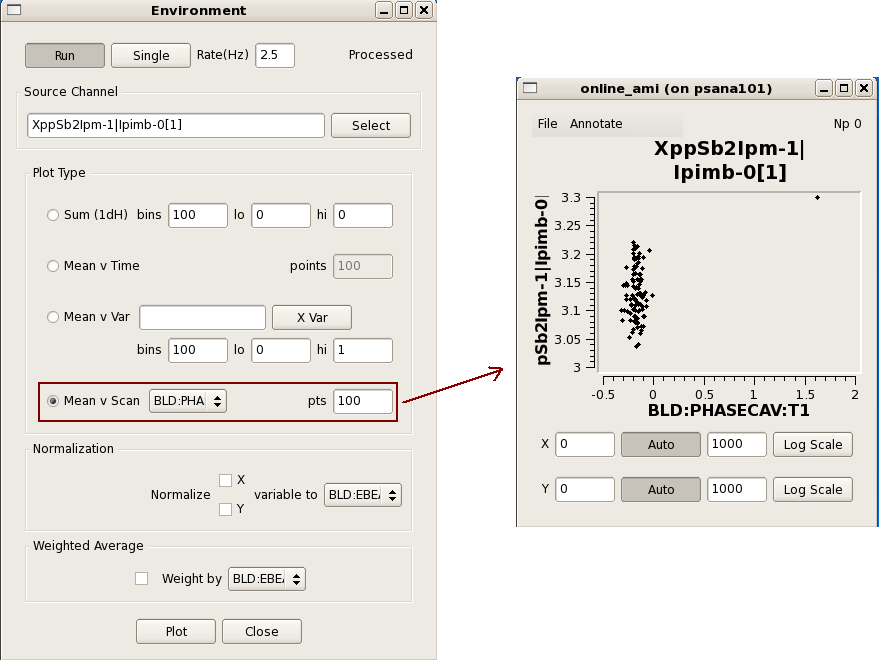
Correlation plots between 2 scalar data object
?
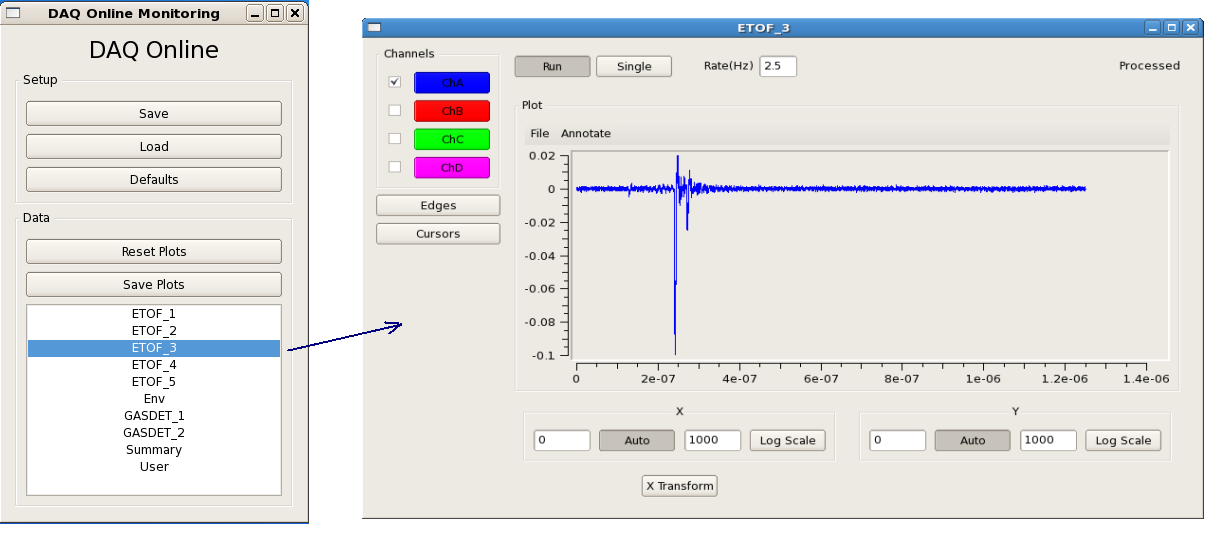
Waveform Display
?
Acqiris Details
?
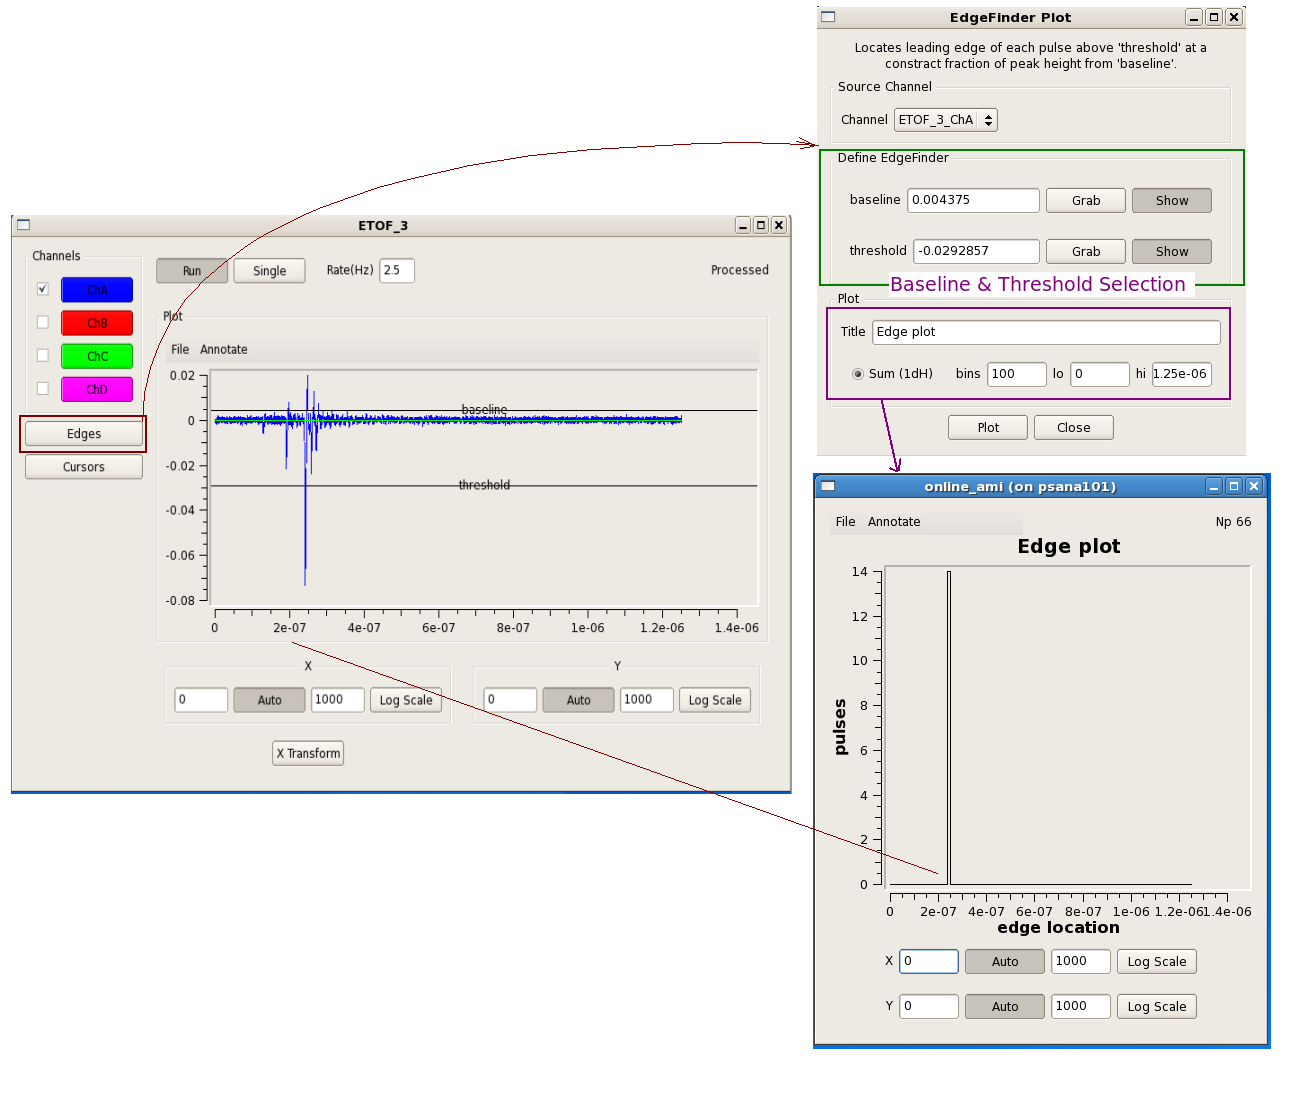
Edge operations
?
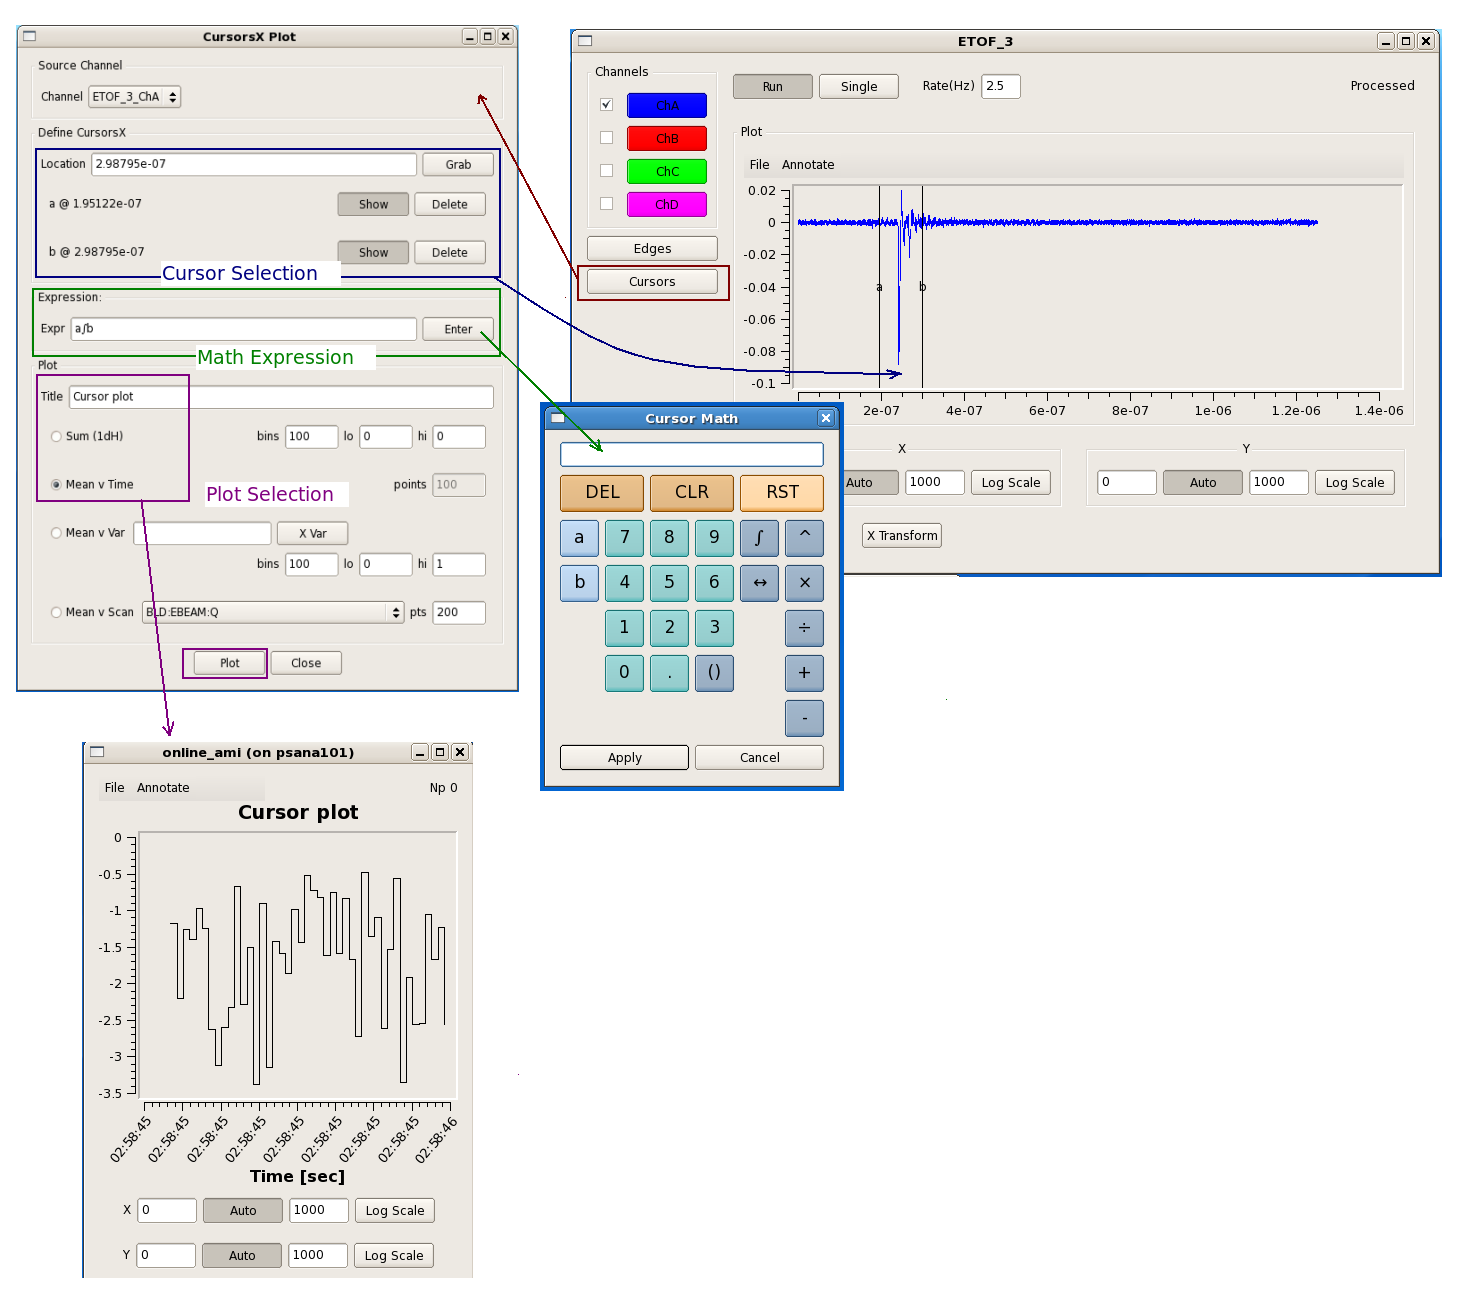
Cursors Operations
Features attched to it which will be covered in following section.
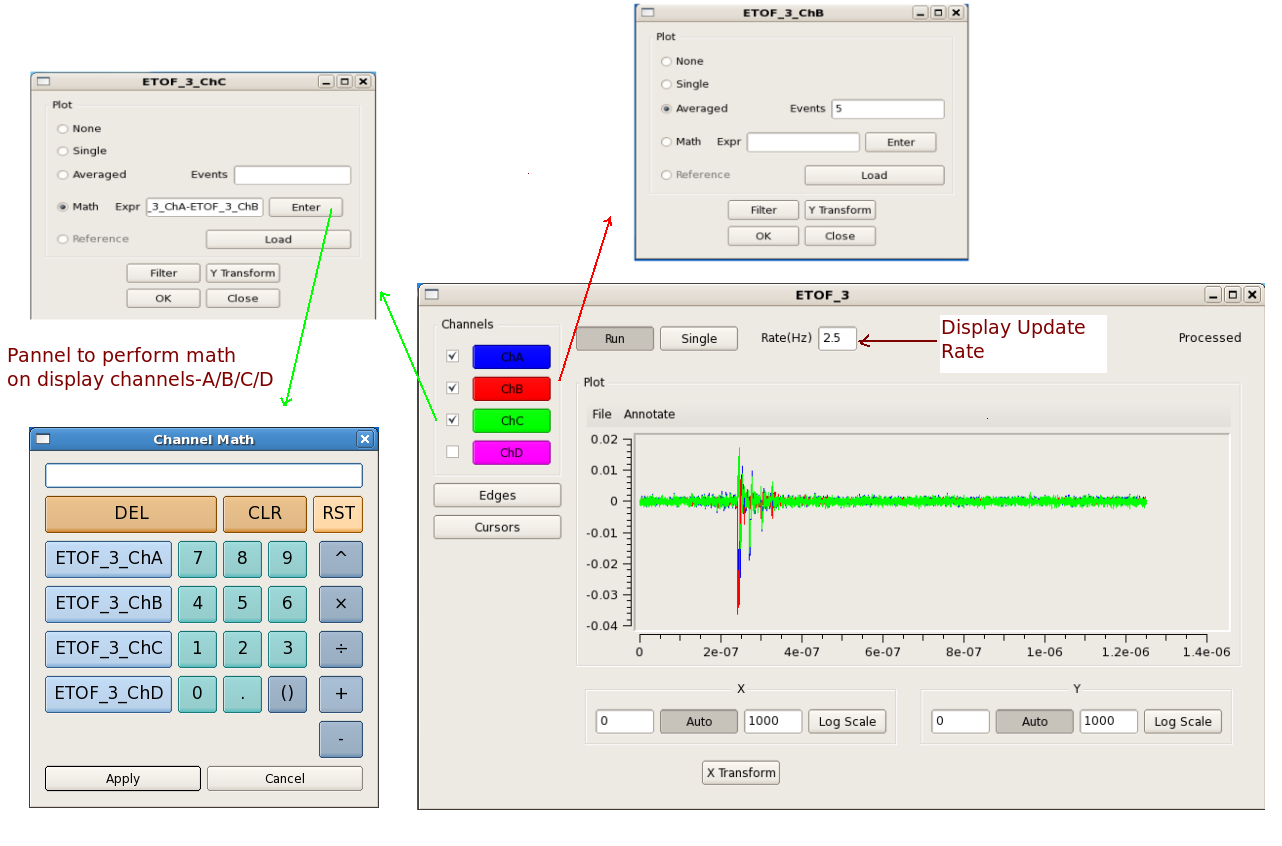
Some speciall function buttons on the calculator
Button | Function |
|---|---|
a ? b | Integrate from a to b |
...
Writing a plug-in to the Online Monitoring GUI
...
The core online monitoring can be specialized by supplying plug-in modules containing user code. These modules can
(1) compute variables to be used in the monitoring GUI,
(2) generate additional plots to be displayed, and
(3) provide a filtering decision for events to be used in the monitoring.
The steps to creating a user module are:
...
| Code Block |
|---|
cp -rf /reg/g/pcds/package/amiuser ~/.
|
...
| Code Block |
|---|
cd ~/amiuser; gedit ExampleAnalysis.cc
|
...
| Code Block |
|---|
make all
|
...
| Code Block |
|---|
cp libamiuser.so ~amoopr/.
|
...
AMI monitoring tool
AMI (Analysis Monitoring Interface) is a user-configurable graphical online monitoring tool that can be used to make informed decisions in response to real-time feedback during an experiment. AMI requires no user coding to produce an analysis. Each instrument is equipped with a few monitoring nodes; most instruments have 6, MEC has 4 and CXI 12. These monitoring nodes receive a fixed fraction of all events containing science data from all detectors. These events are copied to shared memory where the data are made available for monitoring applications. Users may also integrate their own code to perform even more sophisticated or device-specific processing. Analysis results are collected from each node for display to the operator.
AMI allows users to view detector images and perform tasks such as background subtraction, event filtering, and detector correlations. AMI also provides tools to perform many standard analysis tasks such as displaying corrected and raw images and waveforms, displaying data as histograms, strip charts, scatter plots, etc. and performing averaging, filtering, and other generic manipulations of the data including region of interest selection, masking, projections, integration, contrast calculation, and hit finding. The GUI has a set of simple operations that can be cascaded to achieve a variety of monitoring measures.
Multiple sessions of AMI may coexist so that users may monitor the data on different consoles and using different criteria. AMI can be used both on live and offline data without any coding.
Online Monitoring GUI
| Anchor | ||||
|---|---|---|---|---|
|
Using the Online Monitoring GUI
"Restart DAQ" and "Restart Monitoring" icons on operator console bring up multiple GUI panels for DAQ system. A list of primary event displays is shown in the Data panel of the DAQ Online Monitoring window. This list reflects various detectors involved in the current run of the experiment. A mouse click on specific event display will open up a corresponding data monitoring plot. Each type of data plot has multiple features attched to it which will be covered in following section.The Online Monitoring GUI is shown below:
Sources: The Sources panel allows the user to map which monitoring nodes receive events destined for a specific DSS node. In the example above, daq-cxi-mon01 will see the same data that is being recorded by daq-cxi-dss01.
Setup: The Setup panel allows the user to save various display windows and to load a saved setup from a file. "Save" control provides a way to archive configuration of current display windows. (X-Y plots, 2-D frame etc.) Whereas, "Load" control retrives existing display windows configuration. Display configuration is saved in file with extension ".ami" as shown in following figure.
"Defaults" control button provides users a feature to set specific settings (show grid/minor grid etc.) of online monitoring plots as default.
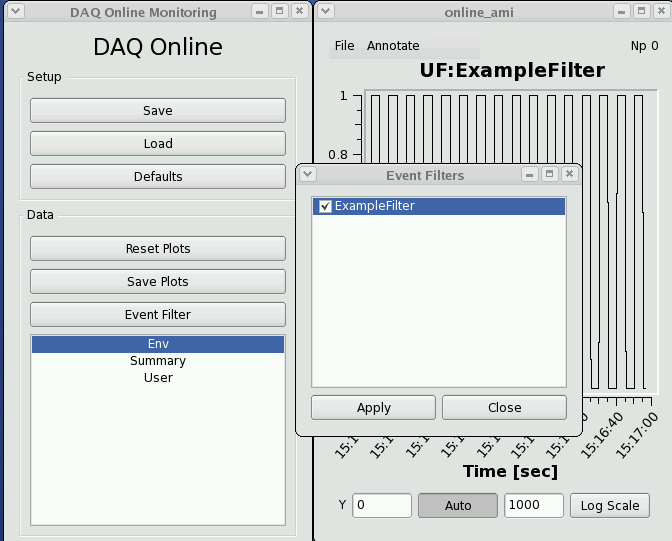
Data: The Data panel shows operations that can be applied to all plots (all data), such as resetting them, applying an event filter, or saving plots. "Reset Plots" control will reset the all displayed plots by clearing their content and restart plotting with a new set of data. Users can save plots using the "Save Plots" button available in this section. Plot data will be saved as a ".dat" file in terms of values associated with its axis.
For X-Y plot (Acqiris Digitizer Waveform), contents of saved plot will be saved as value vectors of X and Y axis in a ".dat" file as shown below:
| No Format |
|---|
1.5e-09  0.000561523
2.5e-09  0.000170898
3.5e-09  0.000170898
4.5e-09  0.000366211
5.5e-09  -0.000195313
6.5e-09  0.000268555
7.5e-09  7.32422e-05
8.5e-09  0.000366211
9.5e-09  7.32422e-05
1.05e-08 7.32422e-05
:
:
|
Rates: The Rates panel at the bottom shows the effective input data rate to AMI and the network bandwidth. The Find Plot button helps a user to bring a specific plot to the foreground.
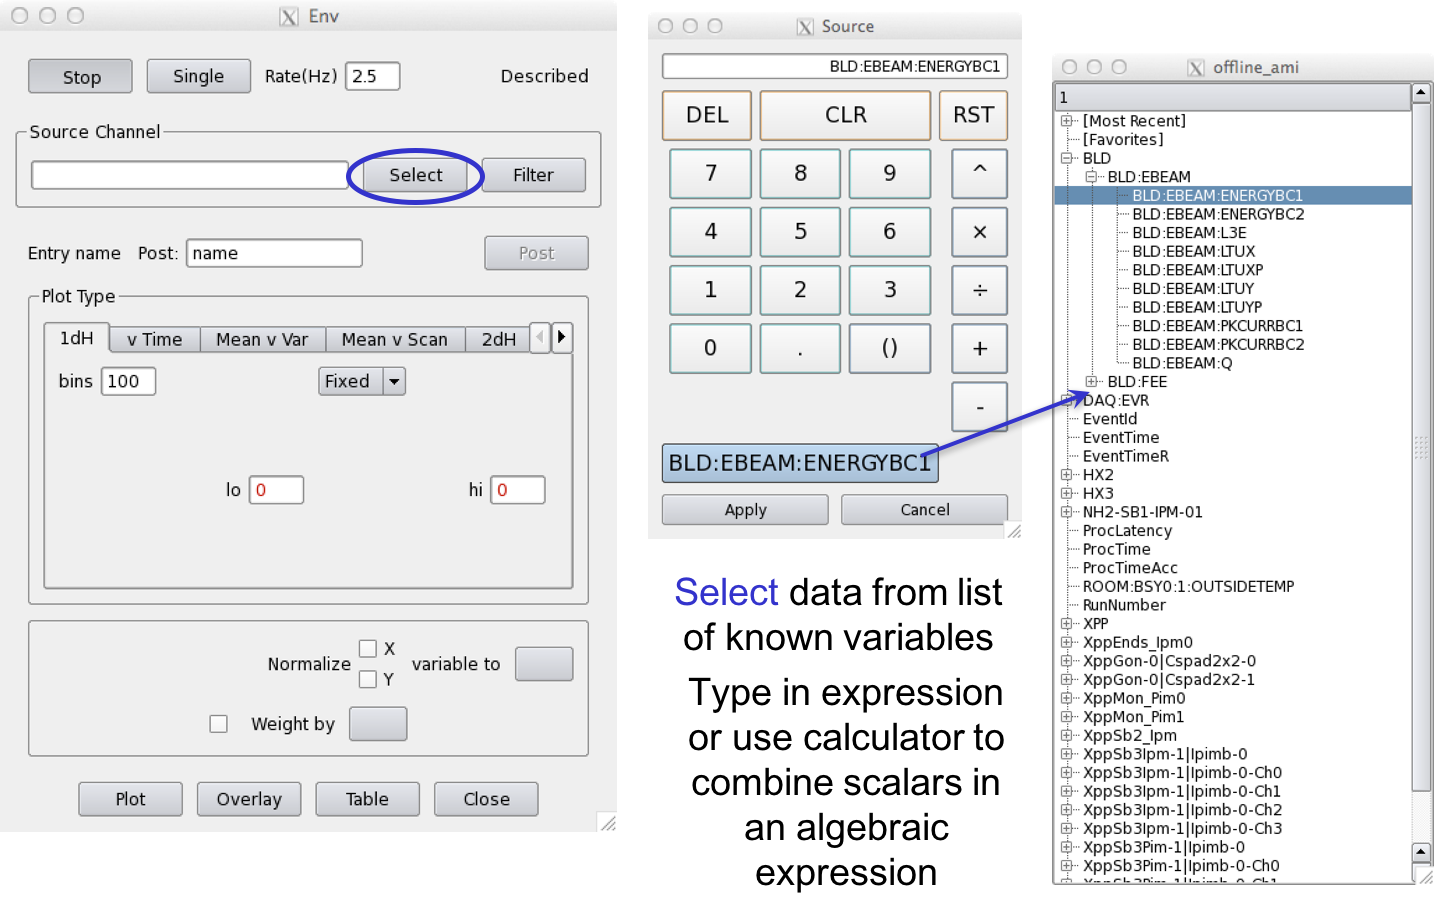
Env Window: Choose Data to Plot
Env or Environment data is all scalar data associated with the event. This includes Event Receiver data, Beamline Data such as the beam energy, phase cavity, and FEE Gas Detector quantities, diode readout values, encoder readout, EPICS variables included in the DAQ data stream, and Posted data, processed detector data for this event (set up elsewhere).
Examples of Scalar variables/data
Ebeam and Ipimb data view details
Correlation plots between 2 scalar data object
Waveform Display
Acqiris Details
Edge operations
Cursors Operations
Features attched to it which will be covered in following section.
Some speciall function buttons on the calculator
Button | Function |
|---|---|
a ∫ b | Integrate from a to b |
a ⨍ b | 1st moment from a to b |
a ⨎ b | 2nd moment from a to b |
a ↔ b | Samples(bins) from a to b |
| Anchor | ||||
|---|---|---|---|---|
|
Writing a plug-in to the Online Monitoring GUI
The core online monitoring can be specialized by supplying plug-in modules containing user code. These modules can
(1) compute variables to be used in the monitoring GUI,
(2) generate additional plots to be displayed, and
(3) provide a filtering decision for events to be used in the monitoring.
The steps to creating a user module are:
Copy /reg/g/pcds/package/amiuser to your area
Code Block cp -rf /reg/g/pcds/package/amiuser ~/.Edit the ExampleAnalysis.{hh,cc} files
Code Block cd ~/amiuser; gedit ExampleAnalysis.ccBuild the libamiuser.so library
Code Block make allCopy the libamiuser.so to your experiment's home area
Code Block cp libamiuser.so ~amoopr/.
The "~amoopr/libamiuser.so" plug-in module is specified explicitly in the "-L" command-line option for the monitoring executable that appears in /reg/g/pcds/dist/pds/amo/scripts/amo.cnf, for example. It is possible to specify a comma separated list of libraries in the "-L" option to include more than one plug-in module.
The plug-in modules will be picked up the next time the DAQ system is restarted.
The UserModule class contains several member functions that must be implemented:
- clear() - unregister plots and disable analysis
- create() - register plots and enable analysis
- reset(featurecache) - called prior to a new configuration with a reference to the cache of event variables
- clock(timestamp) - called once for each event or configuration
- configure(detectorid, datatype, data*) - called for each detector datum in the configuration
- event(detectorid, datatype, data*) - called for each detector datum in the event
- accept() - called once after all 'event()' callbacks have completed; returns a filter decision
- name() - returns the module name
The 'detectorid' arguments are of the form Pds::Src and may be cast for comparison against detector identities such as Pds::DetInfo or BLD identities such as Pds::BldInfo (Pds:: classes from pdsdata/xtc package). The 'datatype' arguments are of the form Pds::TypeId which is a class denoting the data format (image, waveform, etc., and version, also from pdsdata/xtc package). The 'data*' arguments are pointers to the configuration or event data (from pdsdata/<type> package). For the 'configure' callbacks with relevant data, the data should be copied. For the 'event' callbacks, the pointers may simply be copied and referenced when the 'analyze' function is called.
Six types of plots may be displayed { Strip chart, 1D histogram, 1D profile histogram, waveform, 2D image, 2D scatter plot } by instanciating the ami/data classes { EntryScalar, EntryTH1F, EntryProf, EntryWaveform, EntryImage, EntryScan }, respectively. The interfaces for these classes are found in the corresponding release/ami/data/Entry*.hh files. For example, a 1D histogram is created by generating its description
| Code Block |
|---|
DescTH1F(const char* name, const char* xtitle, const char* ytitle, unsigned nbins, float xlow, float xhigh)
|
as found in release/ami/data/DescTH1F.hh and passing it to the EntryTH1F constructor. For example,
| Code Block |
|---|
DescTH1F desc("My Plot","My X title","My Y title",100, 0., 1.);
EntryTH1F* plot = new EntryTH1F( desc );
|
The plot may be filled by calling its function
| Code Block |
|---|
plot->addcontent(weight, x_value);
|
and validated for display by calling
| Code Block |
|---|
plot->valid();
|
See the examples {ExampleAnalysis.cc, AcqirisAnalysis.cc, CamAnalysis.cc}.
The new plots will appear in a section of the online monitoring with a title matching the 'name()' method of the module. By default a separate page is created for each added plot. Multiple plots may appear in the same tab if their titles end in the same string - '#' followed by a page title; for example, two plots titled 'First energy plot#Energy' and 'Second energy plot#Energy' will appear on a page titled 'Energy' with the individual titles 'First energy plot' and 'Second energy plot'. This should allow users to add a few additional plots using operations not supported by the generic monitoring.
The module names will also appear in the 'Event Filters' section of the online monitoring for selection as global filters, and any added variable names will appear in the 'Env' section of the monitoring for use as inputs to other plots. This should allow users to improve the generic monitoring for infrequent or specially classified events. It is also a testbed for how users may be able to reduce recorded data volumes, if so desired.
| Anchor | ||||
|---|---|---|---|---|
|
Writing a user application that reads from shared memory
If you wish to write a user application that reads from shared memory, it is recommended that you get in touch with the hutch point-of-contact for assistance. AMI and psana can both read from shared memory and most analyses can be accomplished within one of the two frameworks.
The shared memory server can either support 1 or multiple clients, depending on the command line flags passed in when the server is launched. Events can be handed to multiple clients in a round-robin style (useful for parallelism) or every client can see all events. Multiple shared memory servers can run on one monitoring node, but each server must have a unique name for its block of memory (seen in /dev/shm).
| Code Block |
|---|
Usage: monshmserver -p <platform> -P <partition> -i <node mask> -n <numb shm buffers> -s <shm buffer size> [options]
Options: -q <# event queues>  (number of queues to hold for clients)
         -t <tag name>        (name of shared memory)
         -d                   (distribute events)
         -c                   (allow remote control of node mask)
         -g <max groups>      (number of event nodes receiving data)
         -T <drop prob>       (test mode - drop transitions)
-h |
Shared memory server flags:
- -c: indicates a shared memory server whose dss node mapping can be dynamically changed. (The psana monshmservers should not have the "-c" flag.)
- -d: distribute each event to a unique clients (other option is all clients are given the same event). A faster client will receive more events in "-d" mode.
-i: bitmask specifying multicast groups (i.e. which dss node's data we see)
-n: total number of buffers. if there are 8 clients, and 8 buffers, each client gets 1 buffer.
- -q: maximum number of clients ("queues") that this shared memory server will send events to
- -s: the buffer size (in bytes) reserved for each event. the event has to fit in this space. if the product of this number and the argument to "-n" is too large, the software can crash because a system shared memory limit has been exceeded.
- -t: "name" of the shared memory (e.g. the "psana" in DataSource('shmem=psana.0:stop=no')
- -P: the partition name used to construct the name of the shared memory. c
The shared memory server can be restarted with a command similar to this:
/reg/g/pcds/dist/pds/tools/procmgr/procmgr restart /reg/g/pcds/dist/pds/cxi/scripts/cxi.cnf monshmsrvpsana |
The last argument is the name of the process which can be found by reading the .cnf file (the previous argument). This command must be run by the same user/machine that the DAQ used to start all its processes (e.g. for CXI it was user "cxiopr" on machine "cxi-daq"). If a shared-memory server is restarted, it loses its cached "configure/beginrun/begcalib" transitions, so the DAQ must redo those transitions for the server to function correctly.
To find out the name of the shared memory segment on a given monitoring node, do something similar to the following:
[cpo@daq-sxr-mon04 ~]$ ls -rtl /dev/shmtotal 74240-rw-rw-rw- 1 sxropr sxropr 1073741824 Oct 15 15:29 PdsMonitorSharedMemory_SXR[cpo@daq-sxr-mon04 ~]$ |
There are shared-memory server log files that are available. On a monitoring node do "ps -ef | grep monshm" you will see the DAQ command line that launched the monshmserver, which includes the name of the output log file.
| Anchor | ||||
|---|---|---|---|---|
|
The "~amoopr/libamiuser.so" plug-in module is specified explicitly in the "-L" command-line option for the monitoring executable that appears in /reg/g/pcds/dist/pds/amo/scripts/amo.cnf, for example. It is possible to specify a comma separated list of libraries in the "-L" option to include more than one plug-in module.
The plug-in modules will be picked up the next time the DAQ system is restarted.
The UserModule class contains several member functions that must be implemented:
- clear() - unregister plots and disable analysis
- create() - register plots and enable analysis
- reset(featurecache) - called prior to a new configuration with a reference to the cache of event variables
- clock(timestamp) - called once for each event or configuration
- configure(detectorid, datatype, data*) - called for each detector datum in the configuration
- event(detectorid, datatype, data*) - called for each detector datum in the event
- accept() - called once after all 'event()' callbacks have completed; returns a filter decision
- name() - returns the module name
The 'detectorid' arguments are of the form Pds::Src and may be cast for comparison against detector identities such as Pds::DetInfo or BLD identities such as Pds::BldInfo (Pds:: classes from pdsdata/xtc package). The 'datatype' arguments are of the form Pds::TypeId which is a class denoting the data format (image, waveform, etc., and version, also from pdsdata/xtc package). The 'data*' arguments are pointers to the configuration or event data (from pdsdata/<type> package). For the 'configure' callbacks with relevant data, the data should be copied. For the 'event' callbacks, the pointers may simply be copied and referenced when the 'analyze' function is called.
Six types of plots may be displayed { Strip chart, 1D histogram, 1D profile histogram, waveform, 2D image, 2D scatter plot } by instanciating the ami/data classes { EntryScalar, EntryTH1F, EntryProf, EntryWaveform, EntryImage, EntryScan }, respectively. The interfaces for these classes are found in the corresponding release/ami/data/Entry*.hh files. For example, a 1D histogram is created by generating its description
| Code Block |
|---|
DescTH1F(const char* name, const char* xtitle, const char* ytitle, unsigned nbins, float xlow, float xhigh)
|
as found in release/ami/data/DescTH1F.hh and passing it to the EntryTH1F constructor. For example,
| Code Block |
|---|
DescTH1F desc("My Plot","My X title","My Y title",100, 0., 1.);
EntryTH1F* plot = new EntryTH1F( desc );
|
The plot may be filled by calling its function
| Code Block |
|---|
plot->addcontent(weight, x_value);
|
and validated for display by calling
| Code Block |
|---|
plot->valid();
|
See the examples {ExampleAnalysis.cc, AcqirisAnalysis.cc, CamAnalysis.cc}.
The new plots will appear in a section of the online monitoring with a title matching the 'name()' method of the module. By default a separate page is created for each added plot. Multiple plots may appear in the same tab if their titles end in the same string - '#' followed by a page title; for example, two plots titled 'First energy plot#Energy' and 'Second energy plot#Energy' will appear on a page titled 'Energy' with the individual titles 'First energy plot' and 'Second energy plot'. This should allow users to add a few additional plots using operations not supported by the generic monitoring.
The module names will also appear in the 'Event Filters' section of the online monitoring for selection as global filters, and any added variable names will appear in the 'Env' section of the monitoring for use as inputs to other plots. This should allow users to improve the generic monitoring for infrequent or specially classified events. It is also a testbed for how users may be able to reduce recorded data volumes, if so desired.
...
Writing a user application (reads from shared memory)
...
The online monitoring system will interface the DAQ system to the
monitoring the monitoring software through a shared memory interface. The two sides
communicate sides communicate with each other via POSIX message queues. The DAQ system
will system will fill the shared memory buffers with events which are also known
as known as transitions. The DAQ system notifies the monitoring software that
each that each buffer is ready by placing a message in the monitor output queue
containing queue containing the index of the newly available event buffer.
When the monitoring software is finished with a shared memory buffer
it buffer it releases the buffer by returning the message via its output queue.
The The DAQ monitoring system does not store events. If no shared memory
buffers memory buffers are available, then any events that go past the monitoring
station monitoring station during that time will not be monitored.
To facilitate the development and testing of monitoring software, SLAC
has SLAC has developed a file server that mimics the DAQ system. Instead of
live of live data from the DAQ system, it reads a file and presents it to the
monitoring the monitoring software via the shared memory interface the same way that
the that the DAQ system does. One difference is that the file server will not
drop not drop events if the monitoring software takes too long. It will wait
indefinitely wait indefinitely for a free buffer for the next event in the file.
To use the example files you will need two shells. The executables are in
releasein release/build/pdsdata/bin/x86_64-linux-dbg. Assuming both shells are in
the in the executable directory, first start the server with something like:
| Code Block |
|---|
./xtcmonserver -f ../../../../opal1k.xtc -n 4 -s 0x700000 -r 120 -p yourname -c 1 [-l]
|
This points the software at the xtc example file, specifying four
message buffers and the size of each message buffer. The -r option
specifies option specifies the rate that events will be sent in cps, limited only by the I/O
and O and CPU speeds of the platform you are running on. The last parameter shown
is shown is a "partition tag" string that is added the name of the message queue, to
allow to allow multiple people to use this mechanism without a "name collision".
If If only one person is using a machine, then just supply a placeholder name.
If there is more than one user on the computer you are using, you
can you can use the partition tag parameter to resolve conflicts. If you use
your use your login name as the partition tag, then you will be guaranteed not
to collide with anyone else.
...
The optional argument, "-l", will cause the server to loop infinitely,
repetitively repetitively supplying all the events in the file.
The buffers referred to above are in the shared memory. If you
donyou don't need the shared memory to add any latency tolerance then
you then you can use a smaller number. Using only one buffer will serialize
the serialize the operation because only one side will be able to read or
write or write at a time. The minimum number of buffers used should be two. The
buffer The buffer size must be large enough for the largest event that will be handled.
The server will load the shared memory buffers with the first
events first events in the file and then wait for the client to start reading the events.
Once the server is started, you can start the client side in the
second the second shell with:
| Code Block |
|---|
./xtcmonclientexample -p yourname -c clientId
|
The first parameter that must be given to the client software is the
partition the partition tag. This must exactly match the partition tag
given tag given to the server side software.
The parameter given with the "-c" option is the client ID. If you are
the are the only user, then just give it a value of zero.
Once running the server will keep supplying the client with events
until events until it runs through the file. It will then exit, unless the optional
optional "-l" command line parameter was given. If the looping option is given
on given on the command line, then the server will endlessly repeat the sequence
of sequence of L1Accept (Laser shot) events in the file and will not terminate
until terminate until the process is killed.
Sample output from running the above can be found here.
To write your own monitoring software, all you have to do is subclass the
XtcMonitorClient the XtcMonitorClient class and override the XtcMonitorClient::processDgram()
method method to supply your own client side processing of the DataGram events
in events in the XTC stream or file supplied by the file server. Below is the example
implemented example implemented by XtcMonClientExample.cc.
| Code Block |
|---|
class MyXtcMonitorClient : public XtcMonitorClient {
  public:
    virtual int processDgram(Dgram* dg) {
      printf("%s transition: time 0x%x/0x%x, payloadSize 0x%x\n",TransitionId::name(dg->seq.service()),
             dg->seq.stamp().fiducials(),dg->seq.stamp().ticks(),dg->xtc.sizeofPayload());
      myLevelIter iter(&(dg->xtc),0);
      iter.iterate();
      return 0;
    };
};
|
The returned integer controls whether the method will be called again
with again with more data. If the method returns a non zero value, then it
will it will not be called again. This allows the client to end the interaction
cleanly interaction cleanly if it chooses to do so.
This method is the callback from the client monitoring when it receives
a receives a buffer in the shared memory. The example above uses an XtcIterator
subclass XtcIterator subclass to drill down into the data and label it. You can provide your
own your own functionality there instead.
Building the example will require you to find the appropriate shared libraries
and libraries and include files. The data format definitions and shared memory support are
in are in a package called 'pdsdata'. You can find the data formats in include
files include files in this directory ...
| Code Block |
|---|
/reg/g/pcds/package/ana/release/pdsdata/ |
...
| Anchor | ||||
|---|---|---|---|---|
|
Writing a user application, offline analysis style (reads from a file)
Each hutch has a server machine dedicated to recording a copy of the data for use of a
quick a quick turnaround file-based analysis. In the AMO hutch, this machine is named daq-amo-ana01;
other other hutches have similarly named machines. This machine "spies" on the data acquisition
system acquisition system and records all data it sees, whether or not the data acquisition system is directed
to record them.
Official runs (recorded for offline analysis) will be found at the path
path "/u2/pcds/pds/<hutch>/<expnum>/<expnum>-r<runnum>-s<slice>-c<chunk>.xtc".
Unofficial runs (not recorded for offline analysis) will be found at a
similar a similar path, where <expnum> is "e0", and <runnum> is derived from the date/time and
can and can be found in the DAQ Control message window.
Files have a typical lifetime of ~3 hours on this server. All official runs should be
found be found on the offline file server (/reg/d/psdm/...) by this time.
The "myana" analysis programs (more info) have a command-line paramater "-L" which directs them to
read to read files still open for writing. This changes the behavior to wait for more data when
endwhen end-of-file is reached until the end-of-run marker is encountered.
| Anchor | ||||
|---|---|---|---|---|
|
XTC playback (a.k.a Offline AMI)
Offline AMI is not yet fully working on S3DF.
There is a DAQ Offline Monitoring program that operates just like the Online Monitoring program except that it includes an additional section at the top of the user interface that allows one to select offline runs stored in directories. To use it, log onto a machine that has access to the xtc directories you would like to use as input data. Then, run:
/reg/g/pcds/dist/pds/x.x.x/dist/pds/ami-current/build/ami/bin/x86_64-rhel7-opt/offline_ami
S3DF: /sdf/group/lcls/ds/daq/ami-current/build/ami/bin/x86_64-rhel7-linuxopt/offline_ami (not working well yet)
where x.x.x ami-current should be the most version in the pds directory (3.3.5 ami-8.2.8-p8.2.4 as of this writing).
Click the Select button and the program will bring up a "Select Directory" dialog. Use that to navigate to the directory containing the xtc files you are interested in. For example:
...
There are some options that can be specified on the command line. These are listed when the --h option is given:
$ ami/bin/x86_64-linuxrhel7-opt/offline_ami -h
Usage: ami/bin/x86_64-linuxrhel7-opt/offline_ami
Wiki Markup
| Wiki Markup |
|---|
\[-i <interface address>\] |
| Wiki Markup |
|---|
\[-s <server mcast group>\] |
| Wiki Markup |
|---|
\[-L <user plug-in path>\] |
| Wiki Markup |
|---|
\[-o <filename for debugging messages>\] |
]
[-i <interface address>]
[-s <server mcast group>]
[-L <user plug-in path>]
[-o <filename for debugging messages>]
[-e <filename for error messages>Wiki Markup
If no options are given, the following defaults are used:
...

